Daytona Beach, FL
Demographics And Statistics
Living In Daytona Beach, Florida Summary
Life in Daytona Beach research summary. HomeSnacks has been using Saturday Night Science to research the quality of life in Daytona Beach over the past nine years using Census, FBI, Zillow, and other primary data sources. Based on the most recently available data, we found the following about life in Daytona Beach:
The population in Daytona Beach is 75,924.
The median home value in Daytona Beach is $245,403.
The median income in Daytona Beach is $50,130.
The cost of living in Daytona Beach is 98 which is 1.0x lower than the national average.
The median rent in Daytona Beach is $1,239.
The unemployment rate in Daytona Beach is 4.6%.
The poverty rate in Daytona Beach is 21.2%.
The average high in Daytona Beach is 80.1° and the average low is 61.6°.
Daytona Beach SnackAbility
Overall SnackAbility
Daytona Beach, FL Crime Report
Crime in Daytona Beach summary. We use data from the FBI to determine the crime rates in Daytona Beach. Key points include:
There were 2,779 total crimes in Daytona Beach in the last reporting year.
The overall crime rate per 100,000 people in Daytona Beach is 3,603.0 / 100k people.
The violent crime rate per 100,000 people in Daytona Beach is 928.3 / 100k people.
The property crime rate per 100,000 people in Daytona Beach is 2,674.7 / 100k people.
Overall, crime in Daytona Beach is 70.01% above the national average.
Total Crimes
Above National Average
Crime In Daytona Beach Comparison Table
| Statistic | Count Raw |
Daytona Beach / 100k People |
Florida / 100k People |
National / 100k People |
|---|---|---|---|---|
| Total Crimes Per 100K | 2,779 | 3,603.0 | 1,687.5 | 2,119.2 |
| Violent Crime | 716 | 928.3 | 267.1 | 359.0 |
| Murder | 13 | 16.9 | 3.9 | 5.0 |
| Robbery | 65 | 84.3 | 38.2 | 61.0 |
| Aggravated Assault | 583 | 755.9 | 197.1 | 256.0 |
| Property Crime | 2,063 | 2,674.7 | 1,420.4 | 1,760.0 |
| Burglary | 259 | 335.8 | 152.5 | 229.0 |
| Larceny | 1,560 | 2,022.6 | 1,144.9 | 1,272.0 |
| Car Theft | 244 | 316.3 | 123.0 | 259.0 |
Daytona Beach, FL Cost Of Living
Cost of living in Daytona Beach summary. We use data on the cost of living to determine how expensive it is to live in Daytona Beach. Real estate prices drive most of the variance in cost of living around Florida. Key points include:
The cost of living in Daytona Beach is 98 with 100 being average.
The cost of living in Daytona Beach is 1.0x lower than the national average.
The median home value in Daytona Beach is $245,403.
The median income in Daytona Beach is $50,130.
Daytona Beach's Overall Cost Of Living
Lower Than The National Average
Cost Of Living In Daytona Beach Comparison Table
| Living Expense | Daytona Beach | Florida | National Average | |
|---|---|---|---|---|
| Overall | 98 | 97 | 100 | |
| Services | 98 | 96 | 100 | |
| Groceries | 101 | 99 | 100 | |
| Health | 93 | 98 | 100 | |
| Housing | 94 | 96 | 100 | |
| Transportation | 103 | 97 | 100 | |
| Utilities | 101 | 95 | 100 | |
Daytona Beach, FL Weather
The average high in Daytona Beach is 80.1° and the average low is 61.6°.
There are 76.6 days of precipitation each year.
Expect an average of 51.5 inches of precipitation each year with 0.0 inches of snow.
| Stat | Daytona Beach |
|---|---|
| Average Annual High | 80.1 |
| Average Annual Low | 61.6 |
| Annual Precipitation Days | 76.6 |
| Average Annual Precipitation | 51.5 |
| Average Annual Snowfall | 0.0 |
Average High
Days of Rain
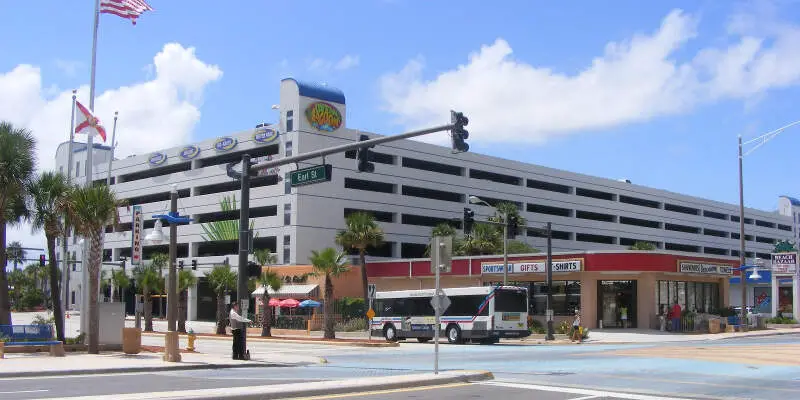
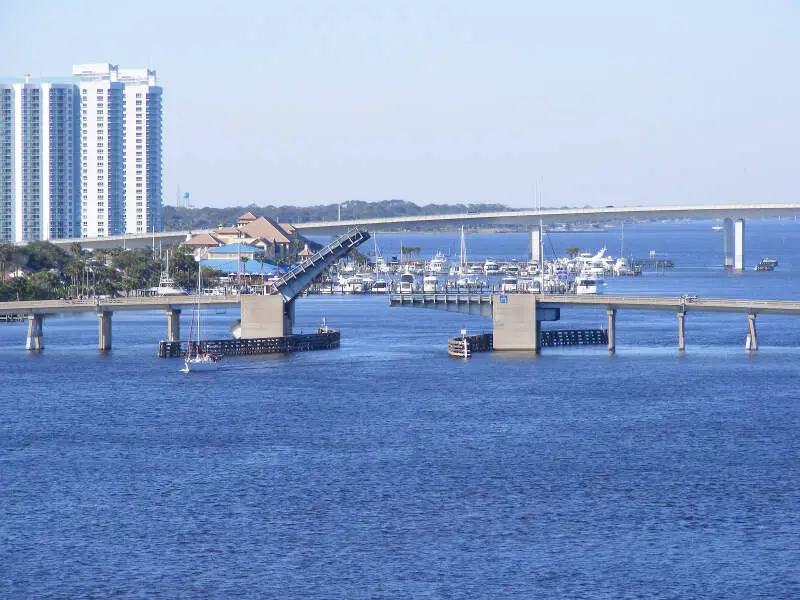
Daytona Beach, FL Photos


Rankings for Daytona Beach in Florida


Locations Around Daytona Beach
Map Of Daytona Beach, FL
Best Places Around Daytona Beach
Port Orange, FL
Population 63,818
Ormond Beach, FL
Population 43,514
Edgewater, FL
Population 23,314
South Daytona, FL
Population 13,322
DeLand, FL
Population 39,832
Holly Hill, FL
Population 13,002
New Smyrna Beach, FL
Population 31,212
Daytona Beach Demographics And Statistics
Population over time in Daytona Beach
The current population in Daytona Beach is 75,924. The population has increased 20.7% from 2010.
| Year | Population | % Change |
|---|---|---|
| 2023 | 75,924 | 3.5% |
| 2022 | 73,329 | 3.2% |
| 2021 | 71,041 | 3.4% |
| 2020 | 68,711 | 1.6% |
| 2019 | 67,604 | 1.6% |
| 2018 | 66,520 | 1.8% |
| 2017 | 65,339 | 1.9% |
| 2016 | 64,105 | 2.2% |
| 2015 | 62,726 | 1.3% |
| 2014 | 61,913 | 0.5% |
| 2013 | 61,622 | -0.3% |
| 2012 | 61,779 | -0.7% |
| 2011 | 62,186 | -1.1% |
| 2010 | 62,905 | - |
Race / Ethnicity in Daytona Beach
Daytona Beach is:
51.0% White with 38,686 White residents.
31.1% African American with 23,638 African American residents.
0.2% American Indian with 139 American Indian residents.
2.8% Asian with 2,141 Asian residents.
0.0% Hawaiian with 29 Hawaiian residents.
0.7% Other with 523 Other residents.
4.2% Two Or More with 3,187 Two Or More residents.
10.0% Hispanic with 7,581 Hispanic residents.
| Race | Daytona Beach | FL | USA |
|---|---|---|---|
| White | 51.0% | 51.4% | 58.2% |
| African American | 31.1% | 14.8% | 12.0% |
| American Indian | 0.2% | 0.1% | 0.5% |
| Asian | 2.8% | 2.8% | 5.7% |
| Hawaiian | 0.0% | 0.1% | 0.2% |
| Other | 0.7% | 0.6% | 0.5% |
| Two Or More | 4.2% | 3.5% | 3.9% |
| Hispanic | 10.0% | 26.7% | 19.0% |
Gender in Daytona Beach
Daytona Beach is 49.8% female with 37,811 female residents.
Daytona Beach is 50.2% male with 38,113 male residents.
| Gender | Daytona Beach | FL | USA |
|---|---|---|---|
| Female | 49.8% | 50.9% | 50.5% |
| Male | 50.2% | 49.1% | 49.5% |
Highest level of educational attainment in Daytona Beach for adults over 25
2.0% of adults in Daytona Beach completed < 9th grade.
6.0% of adults in Daytona Beach completed 9-12th grade.
33.0% of adults in Daytona Beach completed high school / ged.
22.0% of adults in Daytona Beach completed some college.
11.0% of adults in Daytona Beach completed associate's degree.
17.0% of adults in Daytona Beach completed bachelor's degree.
6.0% of adults in Daytona Beach completed master's degree.
2.0% of adults in Daytona Beach completed professional degree.
1.0% of adults in Daytona Beach completed doctorate degree.
| Education | Daytona Beach | FL | USA |
|---|---|---|---|
| < 9th Grade | 2.0% | 5.0% | 5.0% |
| 9-12th Grade | 6.0% | 6.0% | 6.0% |
| High School / GED | 33.0% | 27.0% | 26.0% |
| Some College | 22.0% | 19.0% | 19.0% |
| Associate's Degree | 11.0% | 10.0% | 9.0% |
| Bachelor's Degree | 17.0% | 21.0% | 21.0% |
| Master's Degree | 6.0% | 9.0% | 10.0% |
| Professional Degree | 2.0% | 2.0% | 2.0% |
| Doctorate Degree | 1.0% | 1.0% | 2.0% |
Household Income For Daytona Beach, Florida
8.5% of households in Daytona Beach earn Less than $10,000.
5.5% of households in Daytona Beach earn $10,000 to $14,999.
9.8% of households in Daytona Beach earn $15,000 to $24,999.
11.8% of households in Daytona Beach earn $25,000 to $34,999.
14.2% of households in Daytona Beach earn $35,000 to $49,999.
19.2% of households in Daytona Beach earn $50,000 to $74,999.
13.2% of households in Daytona Beach earn $75,000 to $99,999.
10.7% of households in Daytona Beach earn $100,000 to $149,999.
3.1% of households in Daytona Beach earn $150,000 to $199,999.
3.8% of households in Daytona Beach earn $200,000 or more.
| Income | Daytona Beach | FL | USA |
|---|---|---|---|
| Less than $10,000 | 8.5% | 5.1% | 4.9% |
| $10,000 to $14,999 | 5.5% | 3.4% | 3.6% |
| $15,000 to $24,999 | 9.8% | 7.0% | 6.6% |
| $25,000 to $34,999 | 11.8% | 7.7% | 6.8% |
| $35,000 to $49,999 | 14.2% | 11.6% | 10.4% |
| $50,000 to $74,999 | 19.2% | 17.3% | 15.7% |
| $75,000 to $99,999 | 13.2% | 13.1% | 12.7% |
| $100,000 to $149,999 | 10.7% | 16.8% | 17.4% |
| $150,000 to $199,999 | 3.1% | 8.0% | 9.3% |
| $200,000 or more | 3.8% | 10.1% | 12.6% |


