Elfers SnackAbility
Overall SnackAbility
Cost of living in Elfers summary. We use data on the cost of living to determine how expensive it is to live in Elfers. Real estate prices drive most of the variance in cost of living around Florida. Key points include:
The cost of living in Elfers is 95 with 100 being average.
The cost of living in Elfers is 0.9x lower than the national average.
The median home value in Elfers is $211,688.
The median income in Elfers is $56,054.
Elfers's Overall Cost Of Living
Lower Than The National Average
Cost Of Living In Elfers Comparison Table
| Living Expense | Elfers | Florida | National Average |
|---|---|---|---|
| Overall | 95 | 104 | 100 |
| Services | 101 | 101 | 100 |
| Groceries | 100 | 105 | 100 |
| Health | 70 | 99 | 100 |
| Housing | 102 | 104 | 100 |
| Transportation | 111 | 109 | 100 |
| Utilities | 102 | 105 | 100 |
Source: Cost of living index, normalized to US average = 100
Elfers, FL Weather
The average high in Elfers is 80.5° and the average low is 63.7°.
There are 71.0 days of precipitation each year.
Expect an average of 52.8 inches of precipitation each year with 0.0 inches of snow.
| Stat | Elfers |
|---|---|
| Average Annual High | 80.5 |
| Average Annual Low | 63.7 |
| Annual Precipitation Days | 71.0 |
| Average Annual Precipitation | 52.8 |
| Average Annual Snowfall | 0.0 |
Average High
Days of Rain
Source: NOAA climate normals (30-year)
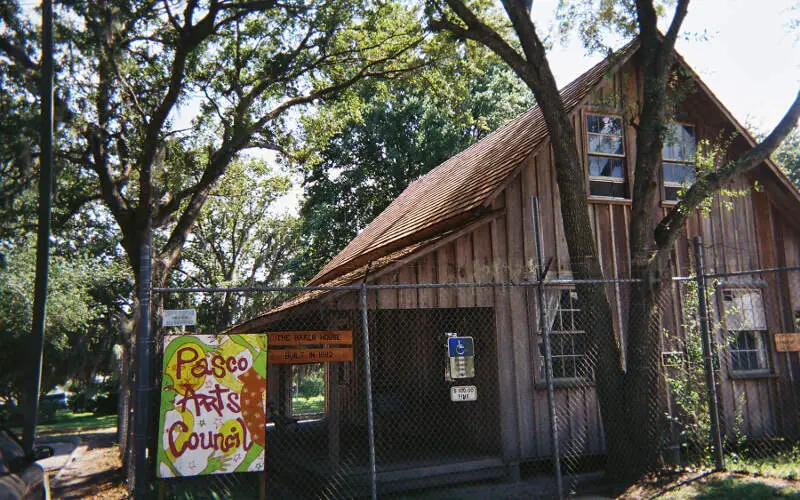
Elfers, FL Photos
Rankings & Articles For Elfers


Locations Around Elfers
Map Of Elfers, FL
Best Places Around Elfers
Safety Harbor, FL
Population 17,033
Carrollwood, FL
Population 36,725
Palm Harbor, FL
Population 61,512
Northdale, FL
Population 25,710
Trinity, FL
Population 18,907
Citrus Park, FL
Population 28,804
Lutz, FL
Population 27,106
Keystone, FL
Population 25,858
Oldsmar, FL
Population 14,904
Westchase, FL
Population 24,885
Elfers Demographics And Statistics
Population over time in Elfers
The current population in Elfers is 15,006. The population has increased 13.5% from 2010.
| Year | Population | % Change |
|---|---|---|
| 2024 | 15,006 | 8.1% |
| 2023 | 13,877 | 4.4% |
| 2022 | 13,296 | -0.6% |
| 2021 | 13,373 | 3.5% |
| 2020 | 12,915 | 2.5% |
| 2019 | 12,600 | -0.3% |
| 2018 | 12,637 | -4.9% |
| 2017 | 13,291 | -0.6% |
| 2016 | 13,375 | -4.3% |
| 2015 | 13,982 | -2.2% |
| 2014 | 14,301 | 4.4% |
| 2013 | 13,700 | 0.6% |
| 2012 | 13,612 | 1.1% |
| 2011 | 13,460 | 1.8% |
| 2010 | 13,223 | - |
Race / Ethnicity in Elfers
See the full breakdown
Elfers is:
74.4% White with 11,161 White residents.
6.0% African American with 900 African American residents.
0.1% American Indian with 20 American Indian residents.
1.3% Asian with 193 Asian residents.
0.1% Hawaiian with 11 Hawaiian residents.
0.1% Other with 17 Other residents.
2.5% Two Or More with 378 Two Or More residents.
15.5% Hispanic with 2,326 Hispanic residents.
| Race | Elfers | FL | USA |
|---|---|---|---|
| White | 74.4% | 50.4% | 57.4% |
| African American | 6.0% | 14.6% | 11.9% |
| American Indian | 0.1% | 0.1% | 0.5% |
| Asian | 1.3% | 2.9% | 5.9% |
| Hawaiian | 0.1% | 0.1% | 0.2% |
| Other | 0.1% | 0.7% | 0.6% |
| Two Or More | 2.5% | 3.8% | 4.3% |
| Hispanic | 15.5% | 27.4% | 19.3% |
Gender in Elfers
See the full breakdown
Elfers is 52.2% female with 7,835 female residents.
Elfers is 47.8% male with 7,170 male residents.
| Gender | Elfers | FL | USA |
|---|---|---|---|
| Female | 52.2% | 50.9% | 50.5% |
| Male | 47.8% | 49.1% | 49.5% |
Highest level of educational attainment in Elfers for adults over 25
See the full breakdown
4.0% of adults in Elfers completed < 9th grade.
10.0% of adults in Elfers completed 9-12th grade.
43.0% of adults in Elfers completed high school / ged.
20.0% of adults in Elfers completed some college.
7.0% of adults in Elfers completed associate's degree.
13.0% of adults in Elfers completed bachelor's degree.
3.0% of adults in Elfers completed master's degree.
0.0% of adults in Elfers completed professional degree.
0.0% of adults in Elfers completed doctorate degree.
| Education | Elfers | FL | USA |
|---|---|---|---|
| < 9th Grade | 4.0% | 5.0% | 4.0% |
| 9-12th Grade | 10.0% | 6.0% | 6.0% |
| High School / GED | 43.0% | 27.0% | 26.0% |
| Some College | 20.0% | 19.0% | 19.0% |
| Associate's Degree | 7.0% | 10.0% | 9.0% |
| Bachelor's Degree | 13.0% | 21.0% | 22.0% |
| Master's Degree | 3.0% | 9.0% | 10.0% |
| Professional Degree | 0.0% | 2.0% | 2.0% |
| Doctorate Degree | 0.0% | 1.0% | 2.0% |
Household Income For Elfers, Florida
See the full breakdown
5.1% of households in Elfers earn Less than $10,000.
3.0% of households in Elfers earn $10,000 to $14,999.
7.9% of households in Elfers earn $15,000 to $24,999.
9.4% of households in Elfers earn $25,000 to $34,999.
20.7% of households in Elfers earn $35,000 to $49,999.
22.3% of households in Elfers earn $50,000 to $74,999.
9.8% of households in Elfers earn $75,000 to $99,999.
13.0% of households in Elfers earn $100,000 to $149,999.
6.1% of households in Elfers earn $150,000 to $199,999.
2.5% of households in Elfers earn $200,000 or more.
| Income | Elfers | FL | USA |
|---|---|---|---|
| Less than $10,000 | 5.1% | 5.1% | 5.0% |
| $10,000 to $14,999 | 3.0% | 3.3% | 3.4% |
| $15,000 to $24,999 | 7.9% | 6.6% | 6.3% |
| $25,000 to $34,999 | 9.4% | 7.3% | 6.6% |
| $35,000 to $49,999 | 20.7% | 11.1% | 10.1% |
| $50,000 to $74,999 | 22.3% | 16.8% | 15.5% |
| $75,000 to $99,999 | 9.8% | 13.1% | 12.6% |
| $100,000 to $149,999 | 13.0% | 17.2% | 17.5% |
| $150,000 to $199,999 | 6.1% | 8.4% | 9.6% |
| $200,000 or more | 2.5% | 11.0% | 13.4% |
Source: U.S. Census ACS 5-year estimates (2024)


