Compare Jacksonville to…
Jacksonville SnackAbility
Overall SnackAbility
Crime in Jacksonville summary. We use data from the FBI to determine the crime rates in Jacksonville. Key points include:
There were 32,856 total crimes in Jacksonville in the last reporting year.
The overall crime rate per 100,000 people in Jacksonville is 3,569.3 / 100k people.
The violent crime rate per 100,000 people in Jacksonville is 697.9 / 100k people.
The property crime rate per 100,000 people in Jacksonville is 2,871.5 / 100k people.
Overall, crime in Jacksonville is 68.43% above the national average.
Total Crimes
Above National Average
Crime In Jacksonville Comparison Table
| Statistic | Count Raw |
Jacksonville / 100k People |
Florida / 100k People |
National / 100k People |
|---|---|---|---|---|
| Total Crimes Per 100K | 32,856 | 3,569.3 | 1,687.5 | 2,119.2 |
| Violent Crime | 6,424 | 697.9 | 267.1 | 359.0 |
| Murder | 140 | 15.2 | 3.9 | 5.0 |
| Robbery | 928 | 100.8 | 38.2 | 61.0 |
| Aggravated Assault | 4,900 | 532.3 | 197.1 | 256.0 |
| Property Crime | 26,432 | 2,871.5 | 1,420.4 | 1,760.0 |
| Burglary | 3,860 | 419.3 | 152.5 | 229.0 |
| Larceny | 19,602 | 2,129.5 | 1,144.9 | 1,272.0 |
| Car Theft | 2,970 | 322.6 | 123.0 | 259.0 |
Source: FBI Uniform Crime Reporting (2024)
Cost of living in Jacksonville summary. We use data on the cost of living to determine how expensive it is to live in Jacksonville. Real estate prices drive most of the variance in cost of living around Florida. Key points include:
The cost of living in Jacksonville is 109 with 100 being average.
The cost of living in Jacksonville is 1.1x higher than the national average.
The median home value in Jacksonville is $282,894.
The median income in Jacksonville is $69,872.
Jacksonville's Overall Cost Of Living
Higher Than The National Average
Cost Of Living In Jacksonville Comparison Table
| Living Expense | Jacksonville | Florida | National Average |
|---|---|---|---|
| Overall | 109 | 104 | 100 |
| Services | 102 | 101 | 100 |
| Groceries | 109 | 105 | 100 |
| Health | 109 | 99 | 100 |
| Housing | 108 | 104 | 100 |
| Transportation | 118 | 109 | 100 |
| Utilities | 112 | 105 | 100 |
Source: Cost of living index, normalized to US average = 100
Jacksonville, FL Weather
The average high in Jacksonville is 79.2° and the average low is 59.8°.
There are 74.3 days of precipitation each year.
Expect an average of 50.5 inches of precipitation each year with 0.1 inches of snow.
| Stat | Jacksonville |
|---|---|
| Average Annual High | 79.2 |
| Average Annual Low | 59.8 |
| Annual Precipitation Days | 74.3 |
| Average Annual Precipitation | 50.5 |
| Average Annual Snowfall | 0.1 |
Average High
Days of Rain
Source: NOAA climate normals (30-year)
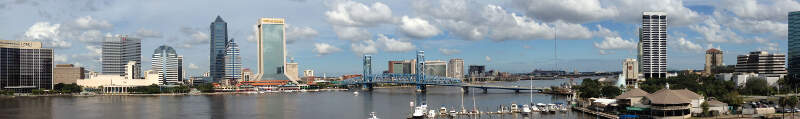
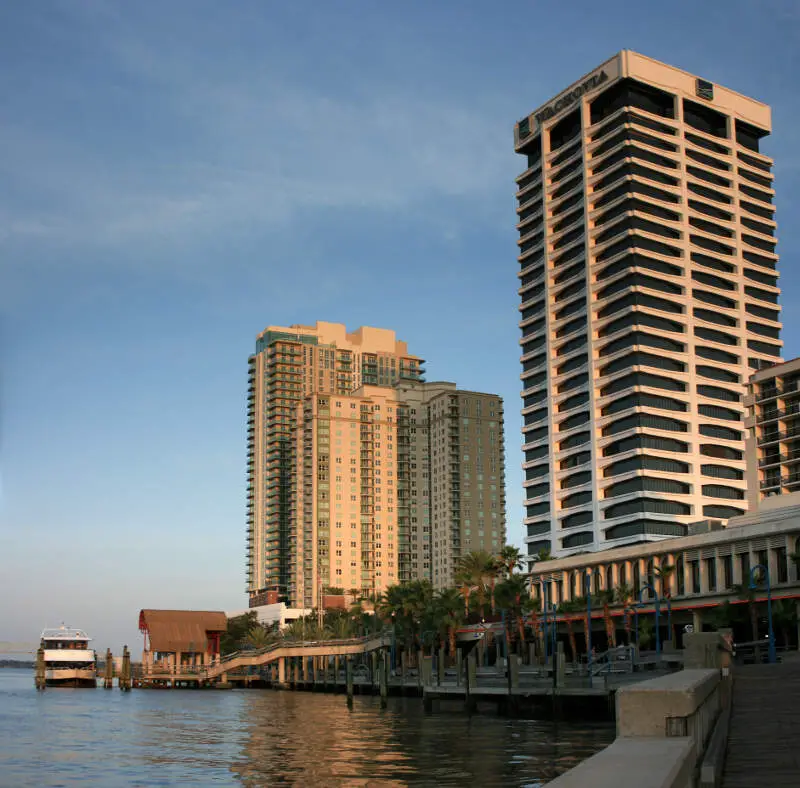
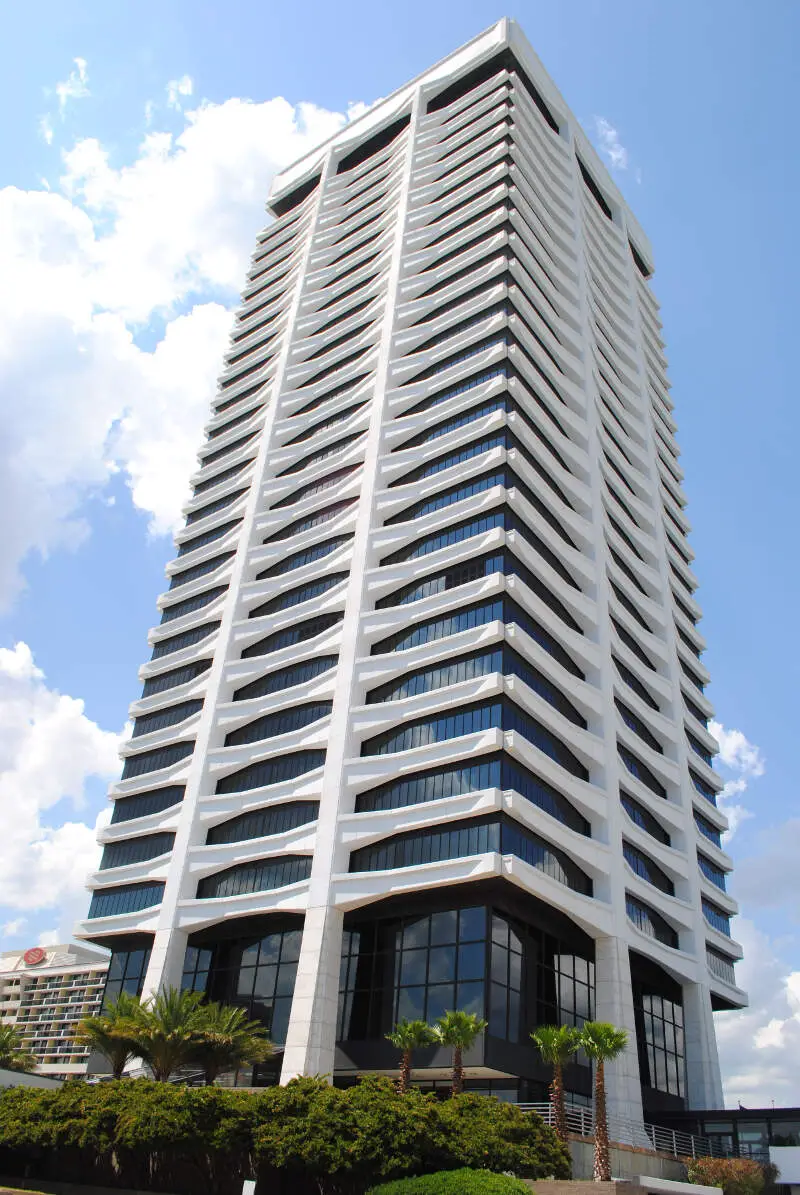
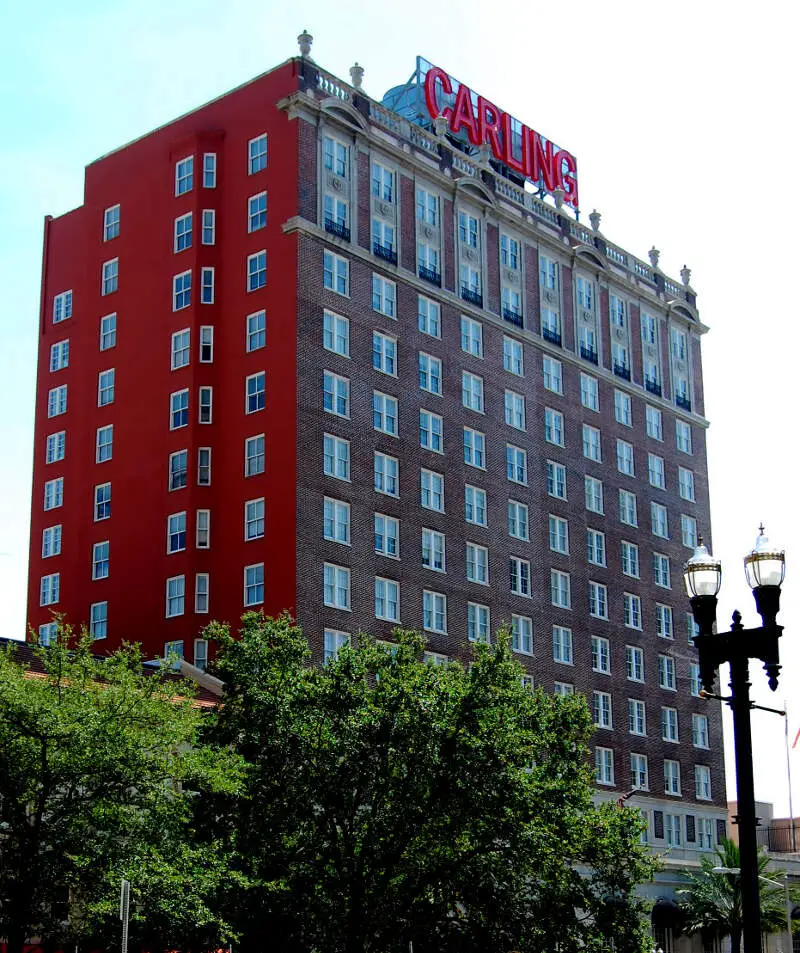
Jacksonville, FL Photos


2 Reviews & Comments About Jacksonville

The crime is low and the schools are wonderful. Anyone should be lucky enough to live here and enjoy the warm sandy beaches.
My favorite place is Wendy's, oh man do they know how to cook a burger.
Do not enjoy going to Arby's that place is just nasty.
I personally don't enjoy Florida in general due to my past experiences but Jacksonville was very trashy in my opinion.
The people! So many very trashy people.... a lot of dirty places, drug activity. It is just not a place I would go back to unless I absolutely had to.
Rankings & Articles For Jacksonville


Locations Around Jacksonville
Map Of Jacksonville, FL
Best Places Around Jacksonville
Lakeside, FL
Population 32,105
Fleming Island, FL
Population 29,766
Fruit Cove, FL
Population 35,877
Palm Valley, FL
Population 19,796
Oakleaf Plantation, FL
Population 32,070
Atlantic Beach, FL
Population 13,363
Bellair-Meadowbrook Terrace, FL
Population 14,755
Jacksonville Beach, FL
Population 23,654
Jacksonville Demographics And Statistics
Population over time in Jacksonville
The current population in Jacksonville is 977,670. The population has increased 20.4% from 2010.
| Year | Population | % Change |
|---|---|---|
| 2024 | 977,670 | 1.7% |
| 2023 | 961,739 | 1.2% |
| 2022 | 950,203 | 1.3% |
| 2021 | 937,690 | 3.9% |
| 2020 | 902,488 | 1.3% |
| 2019 | 890,467 | 1.3% |
| 2018 | 878,907 | 1.3% |
| 2017 | 867,313 | 1.2% |
| 2016 | 856,616 | 1.1% |
| 2015 | 846,951 | 1.1% |
| 2014 | 837,533 | 0.9% |
| 2013 | 829,721 | 0.7% |
| 2012 | 823,652 | 0.7% |
| 2011 | 817,602 | 0.7% |
| 2010 | 811,833 | - |
Race / Ethnicity in Jacksonville
See the full breakdown
Jacksonville is:
46.8% White with 457,529 White residents.
29.3% African American with 286,358 African American residents.
0.1% American Indian with 790 American Indian residents.
5.0% Asian with 49,293 Asian residents.
0.1% Hawaiian with 609 Hawaiian residents.
0.8% Other with 7,795 Other residents.
5.3% Two Or More with 51,884 Two Or More residents.
12.6% Hispanic with 123,412 Hispanic residents.
| Race | Jacksonville | FL | USA |
|---|---|---|---|
| White | 46.8% | 50.4% | 57.4% |
| African American | 29.3% | 14.6% | 11.9% |
| American Indian | 0.1% | 0.1% | 0.5% |
| Asian | 5.0% | 2.9% | 5.9% |
| Hawaiian | 0.1% | 0.1% | 0.2% |
| Other | 0.8% | 0.7% | 0.6% |
| Two Or More | 5.3% | 3.8% | 4.3% |
| Hispanic | 12.6% | 27.4% | 19.3% |
Gender in Jacksonville
See the full breakdown
Jacksonville is 51.5% female with 503,798 female residents.
Jacksonville is 48.5% male with 473,872 male residents.
| Gender | Jacksonville | FL | USA |
|---|---|---|---|
| Female | 51.5% | 50.9% | 50.5% |
| Male | 48.5% | 49.1% | 49.5% |
Highest level of educational attainment in Jacksonville for adults over 25
See the full breakdown
2.0% of adults in Jacksonville completed < 9th grade.
6.0% of adults in Jacksonville completed 9-12th grade.
28.0% of adults in Jacksonville completed high school / ged.
20.0% of adults in Jacksonville completed some college.
10.0% of adults in Jacksonville completed associate's degree.
23.0% of adults in Jacksonville completed bachelor's degree.
8.0% of adults in Jacksonville completed master's degree.
2.0% of adults in Jacksonville completed professional degree.
1.0% of adults in Jacksonville completed doctorate degree.
| Education | Jacksonville | FL | USA |
|---|---|---|---|
| < 9th Grade | 2.0% | 5.0% | 4.0% |
| 9-12th Grade | 6.0% | 6.0% | 6.0% |
| High School / GED | 28.0% | 27.0% | 26.0% |
| Some College | 20.0% | 19.0% | 19.0% |
| Associate's Degree | 10.0% | 10.0% | 9.0% |
| Bachelor's Degree | 23.0% | 21.0% | 22.0% |
| Master's Degree | 8.0% | 9.0% | 10.0% |
| Professional Degree | 2.0% | 2.0% | 2.0% |
| Doctorate Degree | 1.0% | 1.0% | 2.0% |
Household Income For Jacksonville, Florida
See the full breakdown
6.4% of households in Jacksonville earn Less than $10,000.
3.3% of households in Jacksonville earn $10,000 to $14,999.
7.0% of households in Jacksonville earn $15,000 to $24,999.
7.1% of households in Jacksonville earn $25,000 to $34,999.
11.9% of households in Jacksonville earn $35,000 to $49,999.
17.8% of households in Jacksonville earn $50,000 to $74,999.
13.3% of households in Jacksonville earn $75,000 to $99,999.
17.5% of households in Jacksonville earn $100,000 to $149,999.
7.6% of households in Jacksonville earn $150,000 to $199,999.
8.1% of households in Jacksonville earn $200,000 or more.
| Income | Jacksonville | FL | USA |
|---|---|---|---|
| Less than $10,000 | 6.4% | 5.1% | 5.0% |
| $10,000 to $14,999 | 3.3% | 3.3% | 3.4% |
| $15,000 to $24,999 | 7.0% | 6.6% | 6.3% |
| $25,000 to $34,999 | 7.1% | 7.3% | 6.6% |
| $35,000 to $49,999 | 11.9% | 11.1% | 10.1% |
| $50,000 to $74,999 | 17.8% | 16.8% | 15.5% |
| $75,000 to $99,999 | 13.3% | 13.1% | 12.6% |
| $100,000 to $149,999 | 17.5% | 17.2% | 17.5% |
| $150,000 to $199,999 | 7.6% | 8.4% | 9.6% |
| $200,000 or more | 8.1% | 11.0% | 13.4% |
Source: U.S. Census ACS 5-year estimates (2024)


