Lantana, FL
Demographics And Statistics
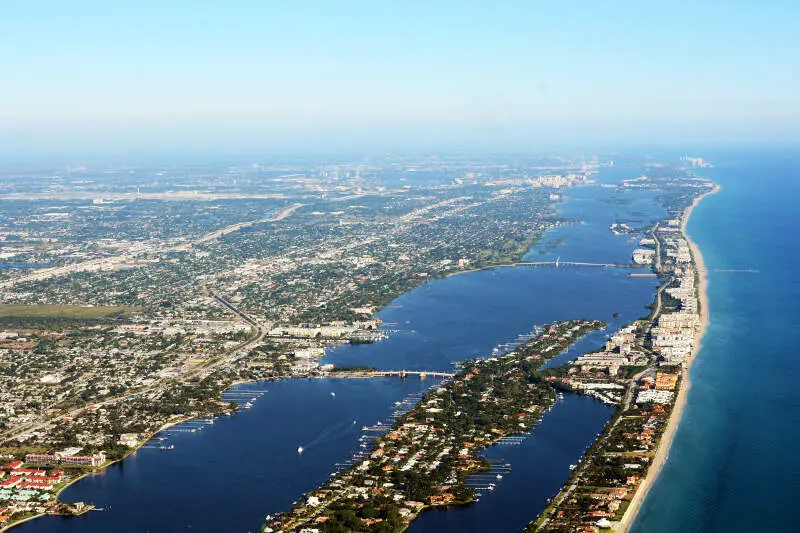
Living In Lantana, Florida Summary
Life in Lantana research summary. HomeSnacks has been using Saturday Night Science to research the quality of life in Lantana over the past nine years using Census, FBI, Zillow, and other primary data sources. Based on the most recently available data, we found the following about life in Lantana:
The population in Lantana is 11,845.
The median home value in Lantana is $434,844.
The median income in Lantana is $69,677.
The cost of living in Lantana is 114 which is 1.1x higher than the national average.
The median rent in Lantana is $1,590.
The unemployment rate in Lantana is 8.4%.
The poverty rate in Lantana is 9.5%.
The average high in Lantana is 82.3° and the average low is 67.9°.
Lantana SnackAbility
Overall SnackAbility
Lantana, FL Crime Report
Crime in Lantana summary. We use data from the FBI to determine the crime rates in Lantana. Key points include:
There were 512 total crimes in Lantana in the last reporting year.
The overall crime rate per 100,000 people in Lantana is 3,992.2 / 100k people.
The violent crime rate per 100,000 people in Lantana is 670.6 / 100k people.
The property crime rate per 100,000 people in Lantana is 3,321.6 / 100k people.
Overall, crime in Lantana is 88.38% above the national average.
Total Crimes
Above National Average
Crime In Lantana Comparison Table
| Statistic | Count Raw |
Lantana / 100k People |
Florida / 100k People |
National / 100k People |
|---|---|---|---|---|
| Total Crimes Per 100K | 512 | 3,992.2 | 1,687.5 | 2,119.2 |
| Violent Crime | 86 | 670.6 | 267.1 | 359.0 |
| Murder | 2 | 15.6 | 3.9 | 5.0 |
| Robbery | 24 | 187.1 | 38.2 | 61.0 |
| Aggravated Assault | 54 | 421.1 | 197.1 | 256.0 |
| Property Crime | 426 | 3,321.6 | 1,420.4 | 1,760.0 |
| Burglary | 39 | 304.1 | 152.5 | 229.0 |
| Larceny | 361 | 2,814.8 | 1,144.9 | 1,272.0 |
| Car Theft | 26 | 202.7 | 123.0 | 259.0 |
Lantana, FL Cost Of Living
Cost of living in Lantana summary. We use data on the cost of living to determine how expensive it is to live in Lantana. Real estate prices drive most of the variance in cost of living around Florida. Key points include:
The cost of living in Lantana is 114 with 100 being average.
The cost of living in Lantana is 1.1x higher than the national average.
The median home value in Lantana is $434,844.
The median income in Lantana is $69,677.
Lantana's Overall Cost Of Living
Higher Than The National Average
Cost Of Living In Lantana Comparison Table
| Living Expense | Lantana | Florida | National Average | |
|---|---|---|---|---|
| Overall | 114 | 97 | 100 | |
| Services | 103 | 96 | 100 | |
| Groceries | 104 | 99 | 100 | |
| Health | 93 | 98 | 100 | |
| Housing | 138 | 96 | 100 | |
| Transportation | 102 | 97 | 100 | |
| Utilities | 104 | 95 | 100 | |
Lantana, FL Weather
The average high in Lantana is 82.3° and the average low is 67.9°.
There are 85.9 days of precipitation each year.
Expect an average of 58.5 inches of precipitation each year with 0.0 inches of snow.
| Stat | Lantana |
|---|---|
| Average Annual High | 82.3 |
| Average Annual Low | 67.9 |
| Annual Precipitation Days | 85.9 |
| Average Annual Precipitation | 58.5 |
| Average Annual Snowfall | 0.0 |
Average High
Days of Rain
Lantana, FL Photos


1 Reviews & Comments About Lantana
/5

HomeSnacks User - 2018-08-27 22:13:56.484032
There is too much crime probably due to poverty in the area.
The number of people hanging around on the street corners.
Rankings for Lantana in Florida


Locations Around Lantana
Map Of Lantana, FL
Best Places Around Lantana
Boca Raton, FL
Population 98,833
Royal Palm Beach, FL
Population 39,089
Palm Beach Gardens, FL
Population 59,751
North Palm Beach, FL
Population 13,089
Greenacres, FL
Population 43,871
The Acreage, FL
Population 40,188
Deerfield Beach, FL
Population 86,742
Wellington, FL
Population 61,497
Boynton Beach, FL
Population 80,601
Palm Springs, FL
Population 26,871
Lantana Demographics And Statistics
Population over time in Lantana
The current population in Lantana is 11,845. The population has increased 14.5% from 2010.
| Year | Population | % Change |
|---|---|---|
| 2023 | 11,845 | 1.2% |
| 2022 | 11,703 | 1.6% |
| 2021 | 11,516 | -3.7% |
| 2020 | 11,958 | 2.2% |
| 2019 | 11,695 | 2.5% |
| 2018 | 11,405 | 1.5% |
| 2017 | 11,240 | 2.0% |
| 2016 | 11,016 | 1.0% |
| 2015 | 10,910 | 0.8% |
| 2014 | 10,822 | 1.4% |
| 2013 | 10,669 | 2.1% |
| 2012 | 10,445 | 0.5% |
| 2011 | 10,392 | 0.4% |
| 2010 | 10,348 | - |
Race / Ethnicity in Lantana
Lantana is:
41.0% White with 4,862 White residents.
36.1% African American with 4,274 African American residents.
0.1% American Indian with 7 American Indian residents.
0.6% Asian with 66 Asian residents.
0.0% Hawaiian with 0 Hawaiian residents.
2.4% Other with 283 Other residents.
1.0% Two Or More with 113 Two Or More residents.
18.9% Hispanic with 2,240 Hispanic residents.
| Race | Lantana | FL | USA |
|---|---|---|---|
| White | 41.0% | 51.4% | 58.2% |
| African American | 36.1% | 14.8% | 12.0% |
| American Indian | 0.1% | 0.1% | 0.5% |
| Asian | 0.6% | 2.8% | 5.7% |
| Hawaiian | 0.0% | 0.1% | 0.2% |
| Other | 2.4% | 0.6% | 0.5% |
| Two Or More | 1.0% | 3.5% | 3.9% |
| Hispanic | 18.9% | 26.7% | 19.0% |
Gender in Lantana
Lantana is 46.5% female with 5,509 female residents.
Lantana is 53.5% male with 6,336 male residents.
| Gender | Lantana | FL | USA |
|---|---|---|---|
| Female | 46.5% | 50.9% | 50.5% |
| Male | 53.5% | 49.1% | 49.5% |
Highest level of educational attainment in Lantana for adults over 25
9.0% of adults in Lantana completed < 9th grade.
4.0% of adults in Lantana completed 9-12th grade.
31.0% of adults in Lantana completed high school / ged.
24.0% of adults in Lantana completed some college.
8.0% of adults in Lantana completed associate's degree.
14.0% of adults in Lantana completed bachelor's degree.
6.0% of adults in Lantana completed master's degree.
4.0% of adults in Lantana completed professional degree.
0.0% of adults in Lantana completed doctorate degree.
| Education | Lantana | FL | USA |
|---|---|---|---|
| < 9th Grade | 9.0% | 5.0% | 5.0% |
| 9-12th Grade | 4.0% | 6.0% | 6.0% |
| High School / GED | 31.0% | 27.0% | 26.0% |
| Some College | 24.0% | 19.0% | 19.0% |
| Associate's Degree | 8.0% | 10.0% | 9.0% |
| Bachelor's Degree | 14.0% | 21.0% | 21.0% |
| Master's Degree | 6.0% | 9.0% | 10.0% |
| Professional Degree | 4.0% | 2.0% | 2.0% |
| Doctorate Degree | 0.0% | 1.0% | 2.0% |
Household Income For Lantana, Florida
5.7% of households in Lantana earn Less than $10,000.
3.1% of households in Lantana earn $10,000 to $14,999.
4.6% of households in Lantana earn $15,000 to $24,999.
7.4% of households in Lantana earn $25,000 to $34,999.
13.9% of households in Lantana earn $35,000 to $49,999.
22.0% of households in Lantana earn $50,000 to $74,999.
8.2% of households in Lantana earn $75,000 to $99,999.
19.4% of households in Lantana earn $100,000 to $149,999.
6.4% of households in Lantana earn $150,000 to $199,999.
9.0% of households in Lantana earn $200,000 or more.
| Income | Lantana | FL | USA |
|---|---|---|---|
| Less than $10,000 | 5.7% | 5.1% | 4.9% |
| $10,000 to $14,999 | 3.1% | 3.4% | 3.6% |
| $15,000 to $24,999 | 4.6% | 7.0% | 6.6% |
| $25,000 to $34,999 | 7.4% | 7.7% | 6.8% |
| $35,000 to $49,999 | 13.9% | 11.6% | 10.4% |
| $50,000 to $74,999 | 22.0% | 17.3% | 15.7% |
| $75,000 to $99,999 | 8.2% | 13.1% | 12.7% |
| $100,000 to $149,999 | 19.4% | 16.8% | 17.4% |
| $150,000 to $199,999 | 6.4% | 8.0% | 9.3% |
| $200,000 or more | 9.0% | 10.1% | 12.6% |


