Boynton Beach, FL
Demographics And Statistics
Living In Boynton Beach, Florida Summary
Life in Boynton Beach research summary. HomeSnacks has been using Saturday Night Science to research the quality of life in Boynton Beach over the past nine years using Census, FBI, Zillow, and other primary data sources. Based on the most recently available data, we found the following about life in Boynton Beach:
The population in Boynton Beach is 80,601.
The median home value in Boynton Beach is $397,643.
The median income in Boynton Beach is $71,378.
The cost of living in Boynton Beach is 111 which is 1.1x higher than the national average.
The median rent in Boynton Beach is $1,896.
The unemployment rate in Boynton Beach is 5.0%.
The poverty rate in Boynton Beach is 11.8%.
The average high in Boynton Beach is 82.3° and the average low is 68.0°.
Boynton Beach SnackAbility
Overall SnackAbility
Boynton Beach, FL Crime Report
Crime in Boynton Beach summary. We use data from the FBI to determine the crime rates in Boynton Beach. Key points include:
There were 2,200 total crimes in Boynton Beach in the last reporting year.
The overall crime rate per 100,000 people in Boynton Beach is 2,700.3 / 100k people.
The violent crime rate per 100,000 people in Boynton Beach is 417.3 / 100k people.
The property crime rate per 100,000 people in Boynton Beach is 2,283.0 / 100k people.
Overall, crime in Boynton Beach is 27.42% above the national average.
Total Crimes
Above National Average
Crime In Boynton Beach Comparison Table
| Statistic | Count Raw |
Boynton Beach / 100k People |
Florida / 100k People |
National / 100k People |
|---|---|---|---|---|
| Total Crimes Per 100K | 2,200 | 2,700.3 | 1,687.5 | 2,119.2 |
| Violent Crime | 340 | 417.3 | 267.1 | 359.0 |
| Murder | 3 | 3.7 | 3.9 | 5.0 |
| Robbery | 63 | 77.3 | 38.2 | 61.0 |
| Aggravated Assault | 244 | 299.5 | 197.1 | 256.0 |
| Property Crime | 1,860 | 2,283.0 | 1,420.4 | 1,760.0 |
| Burglary | 166 | 203.7 | 152.5 | 229.0 |
| Larceny | 1,615 | 1,982.3 | 1,144.9 | 1,272.0 |
| Car Theft | 79 | 97.0 | 123.0 | 259.0 |
Boynton Beach, FL Cost Of Living
Cost of living in Boynton Beach summary. We use data on the cost of living to determine how expensive it is to live in Boynton Beach. Real estate prices drive most of the variance in cost of living around Florida. Key points include:
The cost of living in Boynton Beach is 111 with 100 being average.
The cost of living in Boynton Beach is 1.1x higher than the national average.
The median home value in Boynton Beach is $397,643.
The median income in Boynton Beach is $71,378.
Boynton Beach's Overall Cost Of Living
Higher Than The National Average
Cost Of Living In Boynton Beach Comparison Table
| Living Expense | Boynton Beach | Florida | National Average | |
|---|---|---|---|---|
| Overall | 111 | 97 | 100 | |
| Services | 103 | 96 | 100 | |
| Groceries | 106 | 99 | 100 | |
| Health | 93 | 98 | 100 | |
| Housing | 138 | 96 | 100 | |
| Transportation | 103 | 97 | 100 | |
| Utilities | 104 | 95 | 100 | |
Boynton Beach, FL Weather
The average high in Boynton Beach is 82.3° and the average low is 68.0°.
There are 82.6 days of precipitation each year.
Expect an average of 57.7 inches of precipitation each year with 0.0 inches of snow.
| Stat | Boynton Beach |
|---|---|
| Average Annual High | 82.3 |
| Average Annual Low | 68.0 |
| Annual Precipitation Days | 82.6 |
| Average Annual Precipitation | 57.7 |
| Average Annual Snowfall | 0.0 |
Average High
Days of Rain
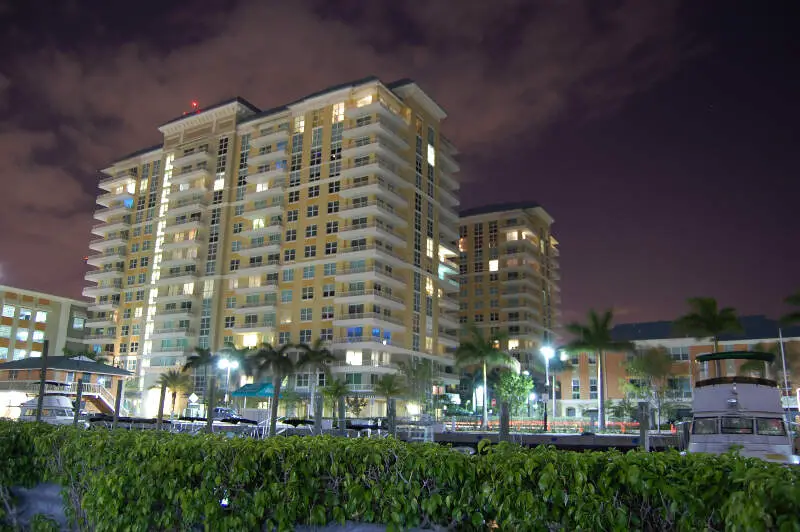
Boynton Beach, FL Photos


Rankings for Boynton Beach in Florida


Locations Around Boynton Beach
Map Of Boynton Beach, FL
Best Places Around Boynton Beach
Coconut Creek, FL
Population 57,587
Boca Raton, FL
Population 98,833
Parkland, FL
Population 35,799
Royal Palm Beach, FL
Population 39,089
Lighthouse Point, FL
Population 10,463
Greenacres, FL
Population 43,871
Deerfield Beach, FL
Population 86,742
Wellington, FL
Population 61,497
Lantana, FL
Population 11,845
Palm Springs, FL
Population 26,871
Boynton Beach Demographics And Statistics
Population over time in Boynton Beach
The current population in Boynton Beach is 80,601. The population has increased 19.3% from 2010.
| Year | Population | % Change |
|---|---|---|
| 2023 | 80,601 | 0.7% |
| 2022 | 80,068 | 0.7% |
| 2021 | 79,479 | 1.8% |
| 2020 | 78,060 | 1.6% |
| 2019 | 76,832 | 1.5% |
| 2018 | 75,720 | 1.7% |
| 2017 | 74,483 | 2.4% |
| 2016 | 72,748 | 1.7% |
| 2015 | 71,530 | 1.7% |
| 2014 | 70,355 | 1.6% |
| 2013 | 69,257 | 1.2% |
| 2012 | 68,467 | 0.8% |
| 2011 | 67,918 | 0.5% |
| 2010 | 67,581 | - |
Race / Ethnicity in Boynton Beach
Boynton Beach is:
44.2% White with 35,629 White residents.
33.4% African American with 26,959 African American residents.
0.1% American Indian with 51 American Indian residents.
2.4% Asian with 1,944 Asian residents.
0.0% Hawaiian with 0 Hawaiian residents.
0.0% Other with 24 Other residents.
3.3% Two Or More with 2,697 Two Or More residents.
16.5% Hispanic with 13,297 Hispanic residents.
| Race | Boynton Beach | FL | USA |
|---|---|---|---|
| White | 44.2% | 51.4% | 58.2% |
| African American | 33.4% | 14.8% | 12.0% |
| American Indian | 0.1% | 0.1% | 0.5% |
| Asian | 2.4% | 2.8% | 5.7% |
| Hawaiian | 0.0% | 0.1% | 0.2% |
| Other | 0.0% | 0.6% | 0.5% |
| Two Or More | 3.3% | 3.5% | 3.9% |
| Hispanic | 16.5% | 26.7% | 19.0% |
Gender in Boynton Beach
Boynton Beach is 52.2% female with 42,077 female residents.
Boynton Beach is 47.8% male with 38,524 male residents.
| Gender | Boynton Beach | FL | USA |
|---|---|---|---|
| Female | 52.2% | 50.9% | 50.5% |
| Male | 47.8% | 49.1% | 49.5% |
Highest level of educational attainment in Boynton Beach for adults over 25
5.0% of adults in Boynton Beach completed < 9th grade.
6.0% of adults in Boynton Beach completed 9-12th grade.
28.0% of adults in Boynton Beach completed high school / ged.
19.0% of adults in Boynton Beach completed some college.
10.0% of adults in Boynton Beach completed associate's degree.
22.0% of adults in Boynton Beach completed bachelor's degree.
7.0% of adults in Boynton Beach completed master's degree.
2.0% of adults in Boynton Beach completed professional degree.
1.0% of adults in Boynton Beach completed doctorate degree.
| Education | Boynton Beach | FL | USA |
|---|---|---|---|
| < 9th Grade | 5.0% | 5.0% | 5.0% |
| 9-12th Grade | 6.0% | 6.0% | 6.0% |
| High School / GED | 28.0% | 27.0% | 26.0% |
| Some College | 19.0% | 19.0% | 19.0% |
| Associate's Degree | 10.0% | 10.0% | 9.0% |
| Bachelor's Degree | 22.0% | 21.0% | 21.0% |
| Master's Degree | 7.0% | 9.0% | 10.0% |
| Professional Degree | 2.0% | 2.0% | 2.0% |
| Doctorate Degree | 1.0% | 1.0% | 2.0% |
Household Income For Boynton Beach, Florida
4.3% of households in Boynton Beach earn Less than $10,000.
2.5% of households in Boynton Beach earn $10,000 to $14,999.
8.2% of households in Boynton Beach earn $15,000 to $24,999.
7.1% of households in Boynton Beach earn $25,000 to $34,999.
12.6% of households in Boynton Beach earn $35,000 to $49,999.
17.6% of households in Boynton Beach earn $50,000 to $74,999.
14.8% of households in Boynton Beach earn $75,000 to $99,999.
18.1% of households in Boynton Beach earn $100,000 to $149,999.
7.8% of households in Boynton Beach earn $150,000 to $199,999.
7.0% of households in Boynton Beach earn $200,000 or more.
| Income | Boynton Beach | FL | USA |
|---|---|---|---|
| Less than $10,000 | 4.3% | 5.1% | 4.9% |
| $10,000 to $14,999 | 2.5% | 3.4% | 3.6% |
| $15,000 to $24,999 | 8.2% | 7.0% | 6.6% |
| $25,000 to $34,999 | 7.1% | 7.7% | 6.8% |
| $35,000 to $49,999 | 12.6% | 11.6% | 10.4% |
| $50,000 to $74,999 | 17.6% | 17.3% | 15.7% |
| $75,000 to $99,999 | 14.8% | 13.1% | 12.7% |
| $100,000 to $149,999 | 18.1% | 16.8% | 17.4% |
| $150,000 to $199,999 | 7.8% | 8.0% | 9.3% |
| $200,000 or more | 7.0% | 10.1% | 12.6% |


