Palm Beach SnackAbility
Overall SnackAbility
Crime in Palm Beach summary. We use data from the FBI to determine the crime rates in Palm Beach. Key points include:
There were 134 total crimes in Palm Beach in the last reporting year.
The overall crime rate per 100,000 people in Palm Beach is 1,446.8 / 100k people.
The violent crime rate per 100,000 people in Palm Beach is 172.7 / 100k people.
The property crime rate per 100,000 people in Palm Beach is 1,274.0 / 100k people.
Overall, crime in Palm Beach is -31.73% below the national average.
Total Crimes
Below National Average
Crime In Palm Beach Comparison Table
| Statistic | Count Raw |
Palm Beach / 100k People |
Florida / 100k People |
National / 100k People |
|---|---|---|---|---|
| Total Crimes Per 100K | 134 | 1,446.8 | 1,687.5 | 2,119.2 |
| Violent Crime | 16 | 172.7 | 267.1 | 359.0 |
| Murder | 0 | 0.0 | 3.9 | 5.0 |
| Robbery | 0 | 0.0 | 38.2 | 61.0 |
| Aggravated Assault | 10 | 108.0 | 197.1 | 256.0 |
| Property Crime | 118 | 1,274.0 | 1,420.4 | 1,760.0 |
| Burglary | 26 | 280.7 | 152.5 | 229.0 |
| Larceny | 90 | 971.7 | 1,144.9 | 1,272.0 |
| Car Theft | 2 | 21.6 | 123.0 | 259.0 |
Source: FBI Uniform Crime Reporting (2024)
Cost of living in Palm Beach summary. We use data on the cost of living to determine how expensive it is to live in Palm Beach. Real estate prices drive most of the variance in cost of living around Florida. Key points include:
The cost of living in Palm Beach is 229 with 100 being average.
The cost of living in Palm Beach is 2.3x higher than the national average.
The median home value in Palm Beach is $2,070,045.
The median income in Palm Beach is $168,403.
Palm Beach's Overall Cost Of Living
Higher Than The National Average
Cost Of Living In Palm Beach Comparison Table
| Living Expense | Palm Beach | Florida | National Average |
|---|---|---|---|
| Overall | 229 | 104 | 100 |
| Services | 103 | 101 | 100 |
| Groceries | 104 | 105 | 100 |
| Health | 527 | 99 | 100 |
| Housing | 104 | 104 | 100 |
| Transportation | 111 | 109 | 100 |
| Utilities | 108 | 105 | 100 |
Source: Cost of living index, normalized to US average = 100
Palm Beach, FL Weather
The average high in Palm Beach is 81.5° and the average low is 67.8°.
There are 85.3 days of precipitation each year.
Expect an average of 59.3 inches of precipitation each year with 0.0 inches of snow.
| Stat | Palm Beach |
|---|---|
| Average Annual High | 81.5 |
| Average Annual Low | 67.8 |
| Annual Precipitation Days | 85.3 |
| Average Annual Precipitation | 59.3 |
| Average Annual Snowfall | 0.0 |
Average High
Days of Rain
Source: NOAA climate normals (30-year)
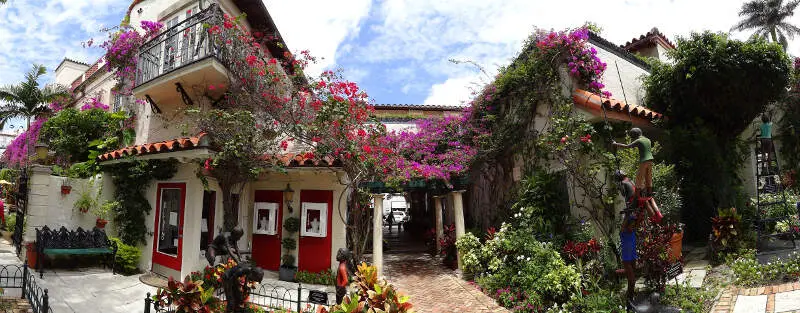
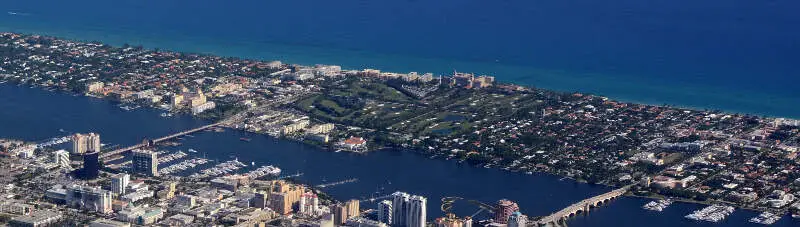
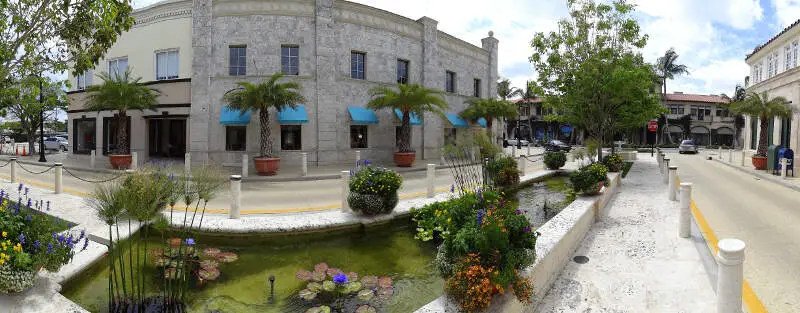
Palm Beach, FL Photos

1 Reviews & Comments About Palm Beach

I live in palm beach it's fun u know nothing they're actually a lot more things than you search get out of Wikipedia. Oh and you should've put winter haven and st Augustine
Rankings & Articles For Palm Beach


Locations Around Palm Beach
Map Of Palm Beach, FL
Best Places Around Palm Beach
Jupiter, FL
Population 61,883
Royal Palm Beach, FL
Population 40,344
Palm Beach Gardens, FL
Population 60,959
North Palm Beach, FL
Population 13,238
Greenacres, FL
Population 44,373
Jupiter Farms, FL
Population 12,945
The Acreage, FL
Population 40,843
Wellington, FL
Population 62,146
Boynton Beach, FL
Population 81,435
Lantana, FL
Population 12,256
Palm Beach Demographics And Statistics
Population over time in Palm Beach
The current population in Palm Beach is 9,348. The population has increased 7.8% from 2010.
| Year | Population | % Change |
|---|---|---|
| 2024 | 9,348 | 1.2% |
| 2023 | 9,234 | 0.3% |
| 2022 | 9,205 | 0.3% |
| 2021 | 9,175 | 4.5% |
| 2020 | 8,776 | 0.6% |
| 2019 | 8,723 | 0.6% |
| 2018 | 8,667 | 0.9% |
| 2017 | 8,593 | 1.1% |
| 2016 | 8,501 | 1.0% |
| 2015 | 8,418 | 0.9% |
| 2014 | 8,344 | -2.1% |
| 2013 | 8,523 | 0.3% |
| 2012 | 8,499 | -0.5% |
| 2011 | 8,545 | -1.5% |
| 2010 | 8,675 | - |
Race / Ethnicity in Palm Beach
See the full breakdown
Palm Beach is:
90.6% White with 8,465 White residents.
0.6% African American with 53 African American residents.
0.1% American Indian with 10 American Indian residents.
1.9% Asian with 174 Asian residents.
0.0% Hawaiian with 0 Hawaiian residents.
0.0% Other with 0 Other residents.
1.4% Two Or More with 133 Two Or More residents.
5.5% Hispanic with 513 Hispanic residents.
| Race | Palm Beach | FL | USA |
|---|---|---|---|
| White | 90.6% | 50.4% | 57.4% |
| African American | 0.6% | 14.6% | 11.9% |
| American Indian | 0.1% | 0.1% | 0.5% |
| Asian | 1.9% | 2.9% | 5.9% |
| Hawaiian | 0.0% | 0.1% | 0.2% |
| Other | 0.0% | 0.7% | 0.6% |
| Two Or More | 1.4% | 3.8% | 4.3% |
| Hispanic | 5.5% | 27.4% | 19.3% |
Gender in Palm Beach
See the full breakdown
Palm Beach is 56.0% female with 5,237 female residents.
Palm Beach is 44.0% male with 4,111 male residents.
| Gender | Palm Beach | FL | USA |
|---|---|---|---|
| Female | 56.0% | 50.9% | 50.5% |
| Male | 44.0% | 49.1% | 49.5% |
Highest level of educational attainment in Palm Beach for adults over 25
See the full breakdown
1.0% of adults in Palm Beach completed < 9th grade.
2.0% of adults in Palm Beach completed 9-12th grade.
10.0% of adults in Palm Beach completed high school / ged.
12.0% of adults in Palm Beach completed some college.
5.0% of adults in Palm Beach completed associate's degree.
34.0% of adults in Palm Beach completed bachelor's degree.
22.0% of adults in Palm Beach completed master's degree.
12.0% of adults in Palm Beach completed professional degree.
2.0% of adults in Palm Beach completed doctorate degree.
| Education | Palm Beach | FL | USA |
|---|---|---|---|
| < 9th Grade | 1.0% | 5.0% | 4.0% |
| 9-12th Grade | 2.0% | 6.0% | 6.0% |
| High School / GED | 10.0% | 27.0% | 26.0% |
| Some College | 12.0% | 19.0% | 19.0% |
| Associate's Degree | 5.0% | 10.0% | 9.0% |
| Bachelor's Degree | 34.0% | 21.0% | 22.0% |
| Master's Degree | 22.0% | 9.0% | 10.0% |
| Professional Degree | 12.0% | 2.0% | 2.0% |
| Doctorate Degree | 2.0% | 1.0% | 2.0% |
Household Income For Palm Beach, Florida
See the full breakdown
6.3% of households in Palm Beach earn Less than $10,000.
1.3% of households in Palm Beach earn $10,000 to $14,999.
3.5% of households in Palm Beach earn $15,000 to $24,999.
3.7% of households in Palm Beach earn $25,000 to $34,999.
3.6% of households in Palm Beach earn $35,000 to $49,999.
5.5% of households in Palm Beach earn $50,000 to $74,999.
5.9% of households in Palm Beach earn $75,000 to $99,999.
17.2% of households in Palm Beach earn $100,000 to $149,999.
5.0% of households in Palm Beach earn $150,000 to $199,999.
47.9% of households in Palm Beach earn $200,000 or more.
| Income | Palm Beach | FL | USA |
|---|---|---|---|
| Less than $10,000 | 6.3% | 5.1% | 5.0% |
| $10,000 to $14,999 | 1.3% | 3.3% | 3.4% |
| $15,000 to $24,999 | 3.5% | 6.6% | 6.3% |
| $25,000 to $34,999 | 3.7% | 7.3% | 6.6% |
| $35,000 to $49,999 | 3.6% | 11.1% | 10.1% |
| $50,000 to $74,999 | 5.5% | 16.8% | 15.5% |
| $75,000 to $99,999 | 5.9% | 13.1% | 12.6% |
| $100,000 to $149,999 | 17.2% | 17.2% | 17.5% |
| $150,000 to $199,999 | 5.0% | 8.4% | 9.6% |
| $200,000 or more | 47.9% | 11.0% | 13.4% |
Source: U.S. Census ACS 5-year estimates (2024)


