Dunwoody SnackAbility
Overall SnackAbility
Crime in Dunwoody summary. We use data from the FBI to determine the crime rates in Dunwoody. Key points include:
There were 1,469 total crimes in Dunwoody in the last reporting year.
The overall crime rate per 100,000 people in Dunwoody is 2,956.5 / 100k people.
The violent crime rate per 100,000 people in Dunwoody is 167.0 / 100k people.
The property crime rate per 100,000 people in Dunwoody is 2,789.5 / 100k people.
Overall, crime in Dunwoody is 39.51% above the national average.
Total Crimes
Above National Average
Crime In Dunwoody Comparison Table
| Statistic | Count Raw |
Dunwoody / 100k People |
Georgia / 100k People |
National / 100k People |
|---|---|---|---|---|
| Total Crimes Per 100K | 1,469 | 2,956.5 | 2,000.6 | 2,119.2 |
| Violent Crime | 83 | 167.0 | 325.7 | 359.0 |
| Murder | 3 | 6.0 | 6.9 | 5.0 |
| Robbery | 22 | 44.3 | 40.8 | 61.0 |
| Aggravated Assault | 50 | 100.6 | 245.9 | 256.0 |
| Property Crime | 1,386 | 2,789.5 | 1,674.9 | 1,760.0 |
| Burglary | 86 | 173.1 | 202.8 | 229.0 |
| Larceny | 1,206 | 2,427.2 | 1,247.3 | 1,272.0 |
| Car Theft | 94 | 189.2 | 224.7 | 259.0 |
Source: FBI Uniform Crime Reporting (2024)
Cost of living in Dunwoody summary. We use data on the cost of living to determine how expensive it is to live in Dunwoody. Real estate prices drive most of the variance in cost of living around Georgia. Key points include:
The cost of living in Dunwoody is 136 with 100 being average.
The cost of living in Dunwoody is 1.4x higher than the national average.
The median home value in Dunwoody is $675,944.
The median income in Dunwoody is $121,903.
Dunwoody's Overall Cost Of Living
Higher Than The National Average
Cost Of Living In Dunwoody Comparison Table
| Living Expense | Dunwoody | Georgia | National Average |
|---|---|---|---|
| Overall | 136 | 95 | 100 |
| Services | 100 | 97 | 100 |
| Groceries | 97 | 99 | 100 |
| Health | 219 | 88 | 100 |
| Housing | 97 | 101 | 100 |
| Transportation | 102 | 104 | 100 |
| Utilities | 102 | 101 | 100 |
Source: Cost of living index, normalized to US average = 100
Dunwoody, GA Weather
The average high in Dunwoody is 70.9° and the average low is 50.3°.
There are 78.8 days of precipitation each year.
Expect an average of 52.5 inches of precipitation each year with 1.0 inches of snow.
| Stat | Dunwoody |
|---|---|
| Average Annual High | 70.9 |
| Average Annual Low | 50.3 |
| Annual Precipitation Days | 78.8 |
| Average Annual Precipitation | 52.5 |
| Average Annual Snowfall | 1.0 |
Average High
Days of Rain
Source: NOAA climate normals (30-year)
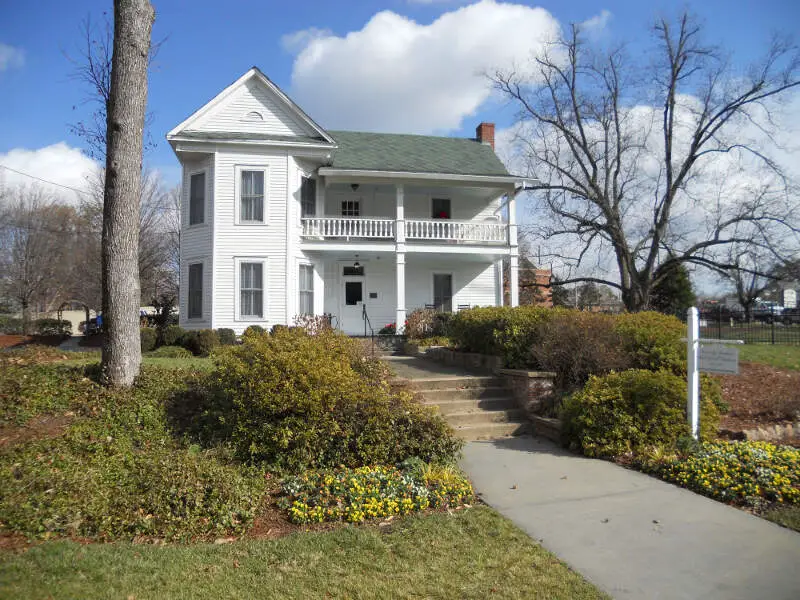
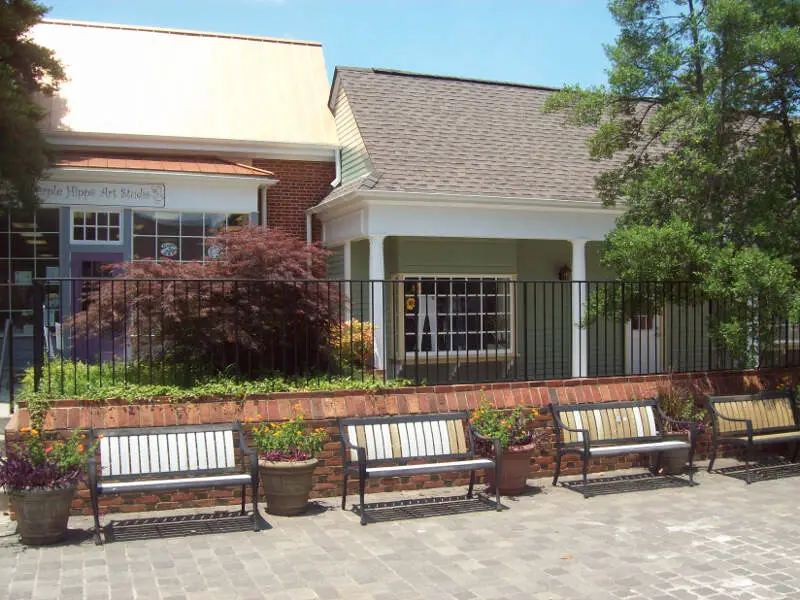
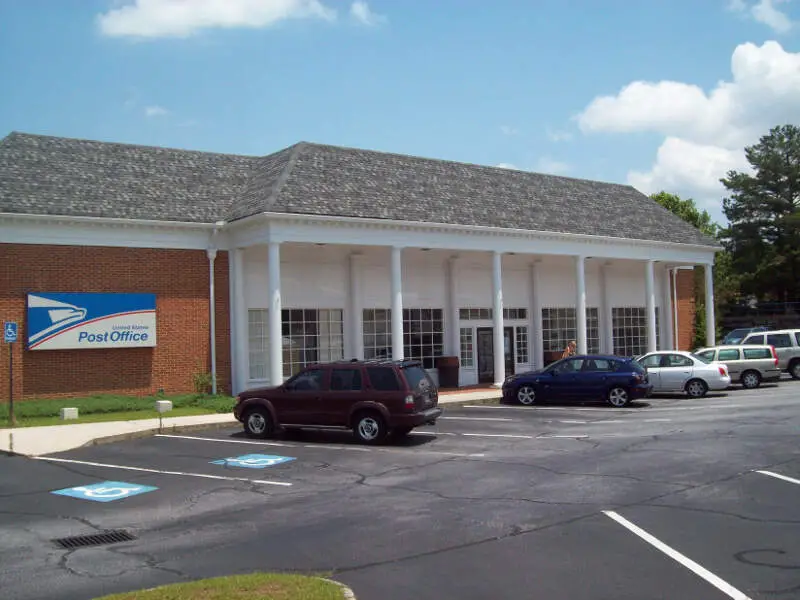
Dunwoody, GA Photos


Rankings & Articles For Dunwoody


Locations Around Dunwoody
Map Of Dunwoody, GA
Best Places Around Dunwoody
Alpharetta, GA
Population 66,855
Roswell, GA
Population 92,621
Mountain Park, GA
Population 12,850
Mountain Park, GA
Population 12,850
Sandy Springs, GA
Population 107,087
Johns Creek, GA
Population 81,988
Decatur, GA
Population 24,518
Suwanee, GA
Population 22,349
Woodstock, GA
Population 37,381
Duluth, GA
Population 32,426
Dunwoody Demographics And Statistics
Population over time in Dunwoody
The current population in Dunwoody is 51,758. The population has increased 15.8% from 2010.
| Year | Population | % Change |
|---|---|---|
| 2024 | 51,758 | 0.4% |
| 2023 | 51,563 | 0.2% |
| 2022 | 51,458 | 0.7% |
| 2021 | 51,103 | 3.3% |
| 2020 | 49,466 | 0.2% |
| 2019 | 49,371 | 0.7% |
| 2018 | 49,016 | 0.3% |
| 2017 | 48,857 | 1.5% |
| 2016 | 48,128 | 0.8% |
| 2015 | 47,727 | 1.2% |
| 2014 | 47,182 | 1.1% |
| 2013 | 46,688 | 1.2% |
| 2012 | 46,133 | 1.4% |
| 2011 | 45,490 | 1.8% |
| 2010 | 44,689 | - |
Race / Ethnicity in Dunwoody
See the full breakdown
Dunwoody is:
53.7% White with 27,775 White residents.
15.4% African American with 7,952 African American residents.
0.0% American Indian with 0 American Indian residents.
14.7% Asian with 7,605 Asian residents.
0.0% Hawaiian with 0 Hawaiian residents.
1.1% Other with 580 Other residents.
4.2% Two Or More with 2,157 Two Or More residents.
11.0% Hispanic with 5,689 Hispanic residents.
| Race | Dunwoody | GA | USA |
|---|---|---|---|
| White | 53.7% | 49.1% | 57.4% |
| African American | 15.4% | 30.7% | 11.9% |
| American Indian | 0.0% | 0.1% | 0.5% |
| Asian | 14.7% | 4.5% | 5.9% |
| Hawaiian | 0.0% | 0.1% | 0.2% |
| Other | 1.1% | 0.6% | 0.6% |
| Two Or More | 4.2% | 3.9% | 4.3% |
| Hispanic | 11.0% | 11.0% | 19.3% |
Gender in Dunwoody
See the full breakdown
Dunwoody is 52.0% female with 26,933 female residents.
Dunwoody is 48.0% male with 24,825 male residents.
| Gender | Dunwoody | GA | USA |
|---|---|---|---|
| Female | 52.0% | 51.2% | 50.5% |
| Male | 48.0% | 48.8% | 49.5% |
Highest level of educational attainment in Dunwoody for adults over 25
See the full breakdown
3.0% of adults in Dunwoody completed < 9th grade.
2.0% of adults in Dunwoody completed 9-12th grade.
8.0% of adults in Dunwoody completed high school / ged.
9.0% of adults in Dunwoody completed some college.
6.0% of adults in Dunwoody completed associate's degree.
40.0% of adults in Dunwoody completed bachelor's degree.
22.0% of adults in Dunwoody completed master's degree.
8.0% of adults in Dunwoody completed professional degree.
2.0% of adults in Dunwoody completed doctorate degree.
| Education | Dunwoody | GA | USA |
|---|---|---|---|
| < 9th Grade | 3.0% | 4.0% | 4.0% |
| 9-12th Grade | 2.0% | 7.0% | 6.0% |
| High School / GED | 8.0% | 27.0% | 26.0% |
| Some College | 9.0% | 19.0% | 19.0% |
| Associate's Degree | 6.0% | 8.0% | 9.0% |
| Bachelor's Degree | 40.0% | 21.0% | 22.0% |
| Master's Degree | 22.0% | 10.0% | 10.0% |
| Professional Degree | 8.0% | 2.0% | 2.0% |
| Doctorate Degree | 2.0% | 2.0% | 2.0% |
Household Income For Dunwoody, Georgia
See the full breakdown
4.1% of households in Dunwoody earn Less than $10,000.
0.9% of households in Dunwoody earn $10,000 to $14,999.
3.0% of households in Dunwoody earn $15,000 to $24,999.
4.7% of households in Dunwoody earn $25,000 to $34,999.
7.5% of households in Dunwoody earn $35,000 to $49,999.
11.9% of households in Dunwoody earn $50,000 to $74,999.
10.0% of households in Dunwoody earn $75,000 to $99,999.
17.0% of households in Dunwoody earn $100,000 to $149,999.
10.3% of households in Dunwoody earn $150,000 to $199,999.
30.6% of households in Dunwoody earn $200,000 or more.
| Income | Dunwoody | GA | USA |
|---|---|---|---|
| Less than $10,000 | 4.1% | 5.4% | 5.0% |
| $10,000 to $14,999 | 0.9% | 3.4% | 3.4% |
| $15,000 to $24,999 | 3.0% | 6.6% | 6.3% |
| $25,000 to $34,999 | 4.7% | 6.8% | 6.6% |
| $35,000 to $49,999 | 7.5% | 10.7% | 10.1% |
| $50,000 to $74,999 | 11.9% | 15.9% | 15.5% |
| $75,000 to $99,999 | 10.0% | 13.0% | 12.6% |
| $100,000 to $149,999 | 17.0% | 17.3% | 17.5% |
| $150,000 to $199,999 | 10.3% | 9.2% | 9.6% |
| $200,000 or more | 30.6% | 11.9% | 13.4% |
Source: U.S. Census ACS 5-year estimates (2024)


