Roswell SnackAbility
Overall SnackAbility
Crime in Roswell summary. We use data from the FBI to determine the crime rates in Roswell. Key points include:
There were 1,084 total crimes in Roswell in the last reporting year.
The overall crime rate per 100,000 people in Roswell is 1,181.0 / 100k people.
The violent crime rate per 100,000 people in Roswell is 160.1 / 100k people.
The property crime rate per 100,000 people in Roswell is 1,020.8 / 100k people.
Overall, crime in Roswell is -44.27% below the national average.
Total Crimes
Below National Average
Crime In Roswell Comparison Table
| Statistic | Count Raw |
Roswell / 100k People |
Georgia / 100k People |
National / 100k People |
|---|---|---|---|---|
| Total Crimes Per 100K | 1,084 | 1,181.0 | 2,000.6 | 2,119.2 |
| Violent Crime | 147 | 160.1 | 325.7 | 359.0 |
| Murder | 2 | 2.2 | 6.9 | 5.0 |
| Robbery | 23 | 25.1 | 40.8 | 61.0 |
| Aggravated Assault | 104 | 113.3 | 245.9 | 256.0 |
| Property Crime | 937 | 1,020.8 | 1,674.9 | 1,760.0 |
| Burglary | 95 | 103.5 | 202.8 | 229.0 |
| Larceny | 784 | 854.1 | 1,247.3 | 1,272.0 |
| Car Theft | 58 | 63.2 | 224.7 | 259.0 |
Source: FBI Uniform Crime Reporting (2024)
Cost of living in Roswell summary. We use data on the cost of living to determine how expensive it is to live in Roswell. Real estate prices drive most of the variance in cost of living around Georgia. Key points include:
The cost of living in Roswell is 129 with 100 being average.
The cost of living in Roswell is 1.3x higher than the national average.
The median home value in Roswell is $658,156.
The median income in Roswell is $128,654.
Roswell's Overall Cost Of Living
Higher Than The National Average
Cost Of Living In Roswell Comparison Table
| Living Expense | Roswell | Georgia | National Average |
|---|---|---|---|
| Overall | 129 | 95 | 100 |
| Services | 101 | 97 | 100 |
| Groceries | 99 | 99 | 100 |
| Health | 194 | 88 | 100 |
| Housing | 100 | 101 | 100 |
| Transportation | 106 | 104 | 100 |
| Utilities | 95 | 101 | 100 |
Source: Cost of living index, normalized to US average = 100
Roswell, GA Weather
The average high in Roswell is 70.8° and the average low is 49.6°.
There are 78.4 days of precipitation each year.
Expect an average of 52.2 inches of precipitation each year with 1.5 inches of snow.
| Stat | Roswell |
|---|---|
| Average Annual High | 70.8 |
| Average Annual Low | 49.6 |
| Annual Precipitation Days | 78.4 |
| Average Annual Precipitation | 52.2 |
| Average Annual Snowfall | 1.5 |
Average High
Days of Rain
Source: NOAA climate normals (30-year)
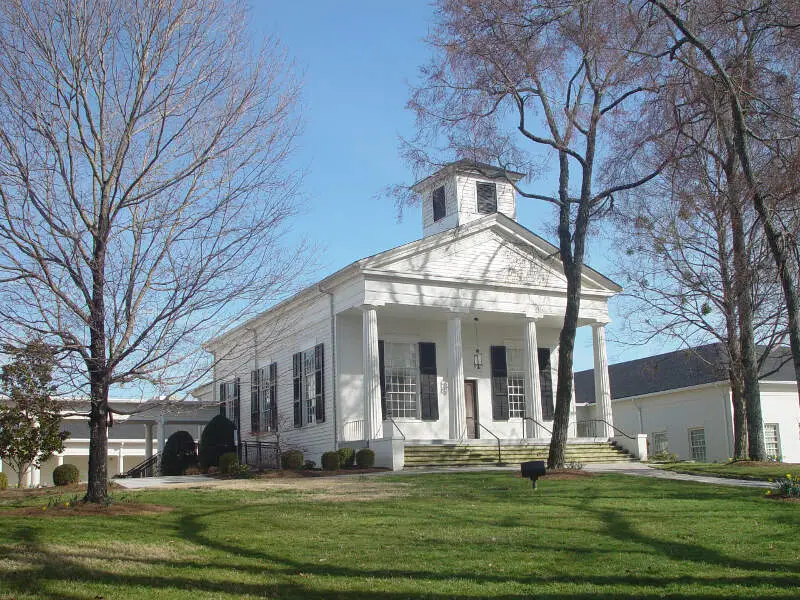
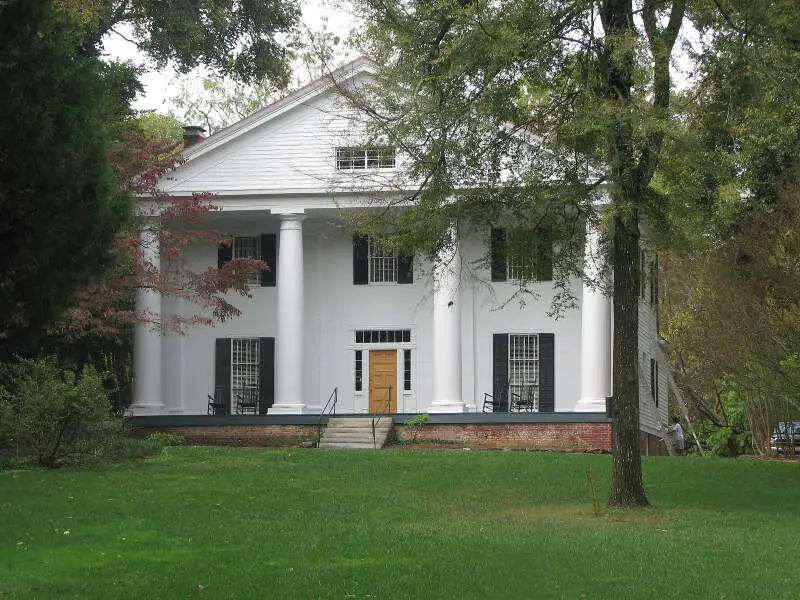
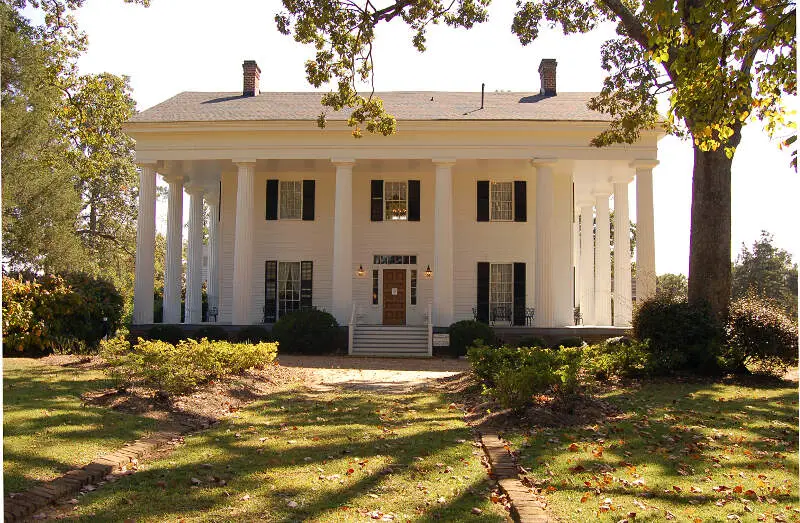
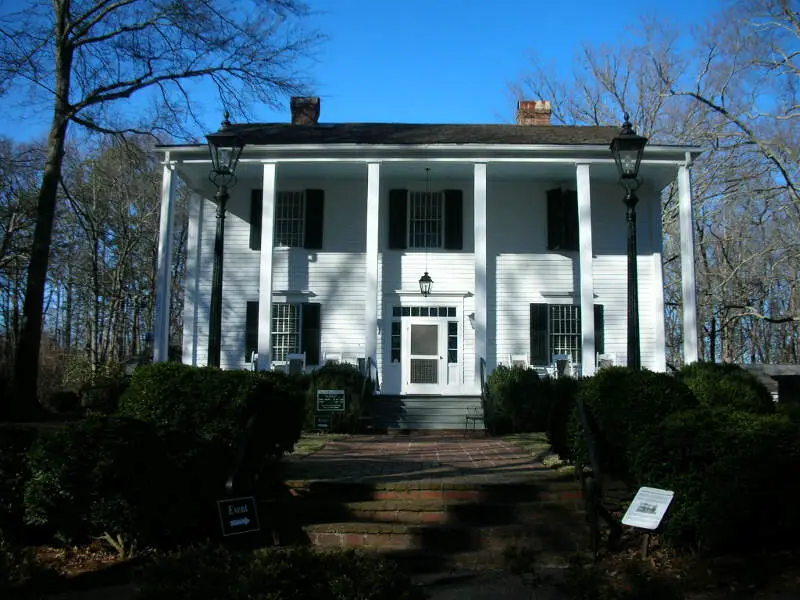
Roswell, GA Photos


2 Reviews & Comments About Roswell

Loved growing up here! Safe, great schools, plenty to do!
The square is perfect for families. The crime rate is very low. Roswell is close to Atlanta without being in the city.
Very low crime rate! Great restaurants in the historic district. Beautiful scenery and dog friendly! Lots of festivals on Canton Street. And, 20 minutes to the city of Atlanta! Not shabby at all! I love it here. Homes are quite expensive!
Canton Street scene.
The Mill Area
Friendly people
Centrally located
At least 4 malls within 5 miles
Close to the mountains
Rankings & Articles For Roswell


Locations Around Roswell
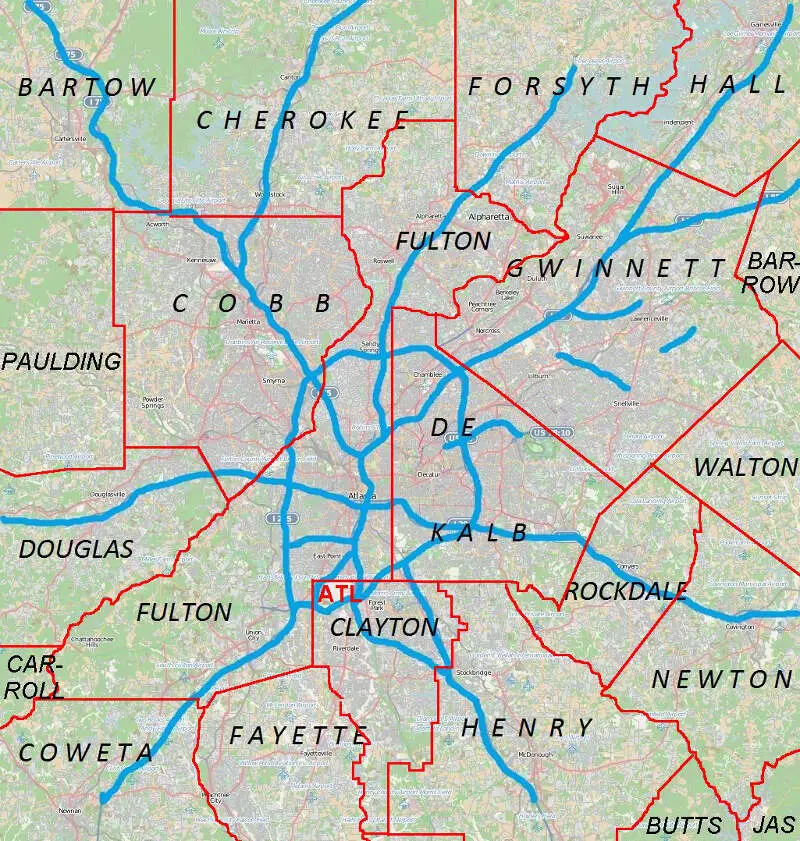
Map Of Roswell, GA
Best Places Around Roswell
Alpharetta, GA
Population 66,855
Mountain Park, GA
Population 12,850
Mountain Park, GA
Population 12,850
Sandy Springs, GA
Population 107,087
Johns Creek, GA
Population 81,988
Decatur, GA
Population 24,518
Suwanee, GA
Population 22,349
Woodstock, GA
Population 37,381
Duluth, GA
Population 32,426
Sugar Hill, GA
Population 26,128
Roswell Demographics And Statistics
Population over time in Roswell
The current population in Roswell is 92,621. The population has increased 8.2% from 2010.
| Year | Population | % Change |
|---|---|---|
| 2024 | 92,621 | 0.0% |
| 2023 | 92,577 | -0.2% |
| 2022 | 92,770 | 0.1% |
| 2021 | 92,688 | -2.3% |
| 2020 | 94,884 | 0.4% |
| 2019 | 94,498 | 0.3% |
| 2018 | 94,257 | 0.0% |
| 2017 | 94,239 | 0.3% |
| 2016 | 93,968 | 0.5% |
| 2015 | 93,471 | 1.2% |
| 2014 | 92,364 | 1.5% |
| 2013 | 90,959 | 1.9% |
| 2012 | 89,294 | 2.2% |
| 2011 | 87,413 | 2.1% |
| 2010 | 85,638 | - |
Race / Ethnicity in Roswell
See the full breakdown
Roswell is:
60.4% White with 55,981 White residents.
11.6% African American with 10,788 African American residents.
0.1% American Indian with 60 American Indian residents.
4.7% Asian with 4,364 Asian residents.
0.0% Hawaiian with 36 Hawaiian residents.
1.2% Other with 1,140 Other residents.
5.6% Two Or More with 5,146 Two Or More residents.
16.3% Hispanic with 15,106 Hispanic residents.
| Race | Roswell | GA | USA |
|---|---|---|---|
| White | 60.4% | 49.1% | 57.4% |
| African American | 11.6% | 30.7% | 11.9% |
| American Indian | 0.1% | 0.1% | 0.5% |
| Asian | 4.7% | 4.5% | 5.9% |
| Hawaiian | 0.0% | 0.1% | 0.2% |
| Other | 1.2% | 0.6% | 0.6% |
| Two Or More | 5.6% | 3.9% | 4.3% |
| Hispanic | 16.3% | 11.0% | 19.3% |
Gender in Roswell
See the full breakdown
Roswell is 50.3% female with 46,573 female residents.
Roswell is 49.7% male with 46,048 male residents.
| Gender | Roswell | GA | USA |
|---|---|---|---|
| Female | 50.3% | 51.2% | 50.5% |
| Male | 49.7% | 48.8% | 49.5% |
Highest level of educational attainment in Roswell for adults over 25
See the full breakdown
3.0% of adults in Roswell completed < 9th grade.
2.0% of adults in Roswell completed 9-12th grade.
11.0% of adults in Roswell completed high school / ged.
12.0% of adults in Roswell completed some college.
6.0% of adults in Roswell completed associate's degree.
42.0% of adults in Roswell completed bachelor's degree.
18.0% of adults in Roswell completed master's degree.
4.0% of adults in Roswell completed professional degree.
2.0% of adults in Roswell completed doctorate degree.
| Education | Roswell | GA | USA |
|---|---|---|---|
| < 9th Grade | 3.0% | 4.0% | 4.0% |
| 9-12th Grade | 2.0% | 7.0% | 6.0% |
| High School / GED | 11.0% | 27.0% | 26.0% |
| Some College | 12.0% | 19.0% | 19.0% |
| Associate's Degree | 6.0% | 8.0% | 9.0% |
| Bachelor's Degree | 42.0% | 21.0% | 22.0% |
| Master's Degree | 18.0% | 10.0% | 10.0% |
| Professional Degree | 4.0% | 2.0% | 2.0% |
| Doctorate Degree | 2.0% | 2.0% | 2.0% |
Household Income For Roswell, Georgia
See the full breakdown
2.9% of households in Roswell earn Less than $10,000.
1.5% of households in Roswell earn $10,000 to $14,999.
3.4% of households in Roswell earn $15,000 to $24,999.
3.6% of households in Roswell earn $25,000 to $34,999.
6.1% of households in Roswell earn $35,000 to $49,999.
10.7% of households in Roswell earn $50,000 to $74,999.
9.1% of households in Roswell earn $75,000 to $99,999.
19.2% of households in Roswell earn $100,000 to $149,999.
12.4% of households in Roswell earn $150,000 to $199,999.
31.1% of households in Roswell earn $200,000 or more.
| Income | Roswell | GA | USA |
|---|---|---|---|
| Less than $10,000 | 2.9% | 5.4% | 5.0% |
| $10,000 to $14,999 | 1.5% | 3.4% | 3.4% |
| $15,000 to $24,999 | 3.4% | 6.6% | 6.3% |
| $25,000 to $34,999 | 3.6% | 6.8% | 6.6% |
| $35,000 to $49,999 | 6.1% | 10.7% | 10.1% |
| $50,000 to $74,999 | 10.7% | 15.9% | 15.5% |
| $75,000 to $99,999 | 9.1% | 13.0% | 12.6% |
| $100,000 to $149,999 | 19.2% | 17.3% | 17.5% |
| $150,000 to $199,999 | 12.4% | 9.2% | 9.6% |
| $200,000 or more | 31.1% | 11.9% | 13.4% |
Source: U.S. Census ACS 5-year estimates (2024)


