Savannah SnackAbility
Overall SnackAbility
Cost of living in Savannah summary. We use data on the cost of living to determine how expensive it is to live in Savannah. Real estate prices drive most of the variance in cost of living around Georgia. Key points include:
The cost of living in Savannah is 100 with 100 being average.
The cost of living in Savannah is 1.0x lower than the national average.
The median home value in Savannah is $326,508.
The median income in Savannah is $57,137.
Savannah's Overall Cost Of Living
Lower Than The National Average
Cost Of Living In Savannah Comparison Table
| Living Expense | Savannah | Georgia | National Average |
|---|---|---|---|
| Overall | 100 | 95 | 100 |
| Services | 100 | 97 | 100 |
| Groceries | 101 | 99 | 100 |
| Health | 95 | 88 | 100 |
| Housing | 98 | 101 | 100 |
| Transportation | 105 | 104 | 100 |
| Utilities | 101 | 101 | 100 |
Source: Cost of living index, normalized to US average = 100
Savannah, GA Weather
The average high in Savannah is 76.8° and the average low is 56.3°.
There are 70.4 days of precipitation each year.
Expect an average of 49.9 inches of precipitation each year with 0.2 inches of snow.
| Stat | Savannah |
|---|---|
| Average Annual High | 76.8 |
| Average Annual Low | 56.3 |
| Annual Precipitation Days | 70.4 |
| Average Annual Precipitation | 49.9 |
| Average Annual Snowfall | 0.2 |
Average High
Days of Rain
Source: NOAA climate normals (30-year)
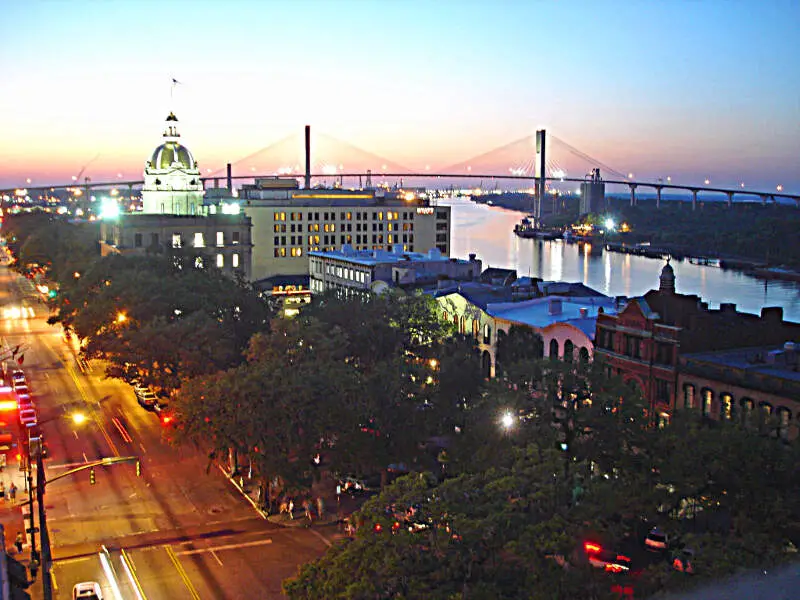
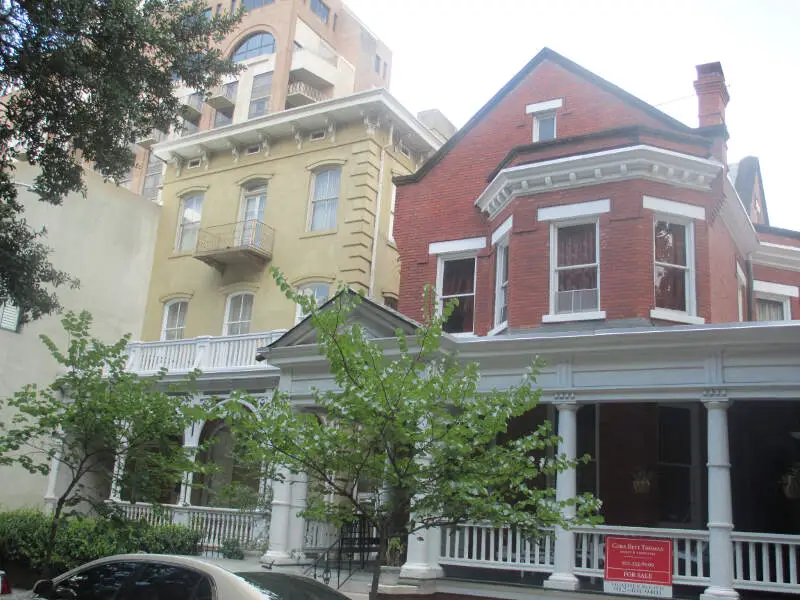
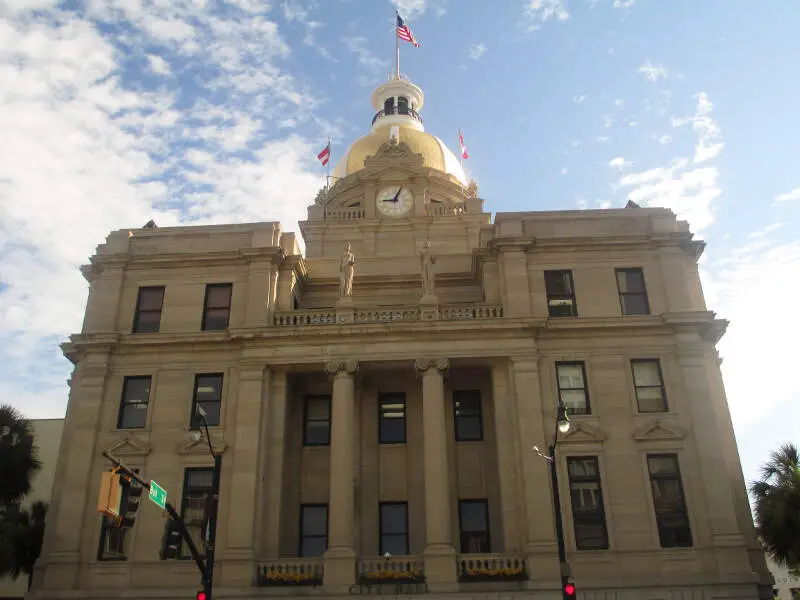
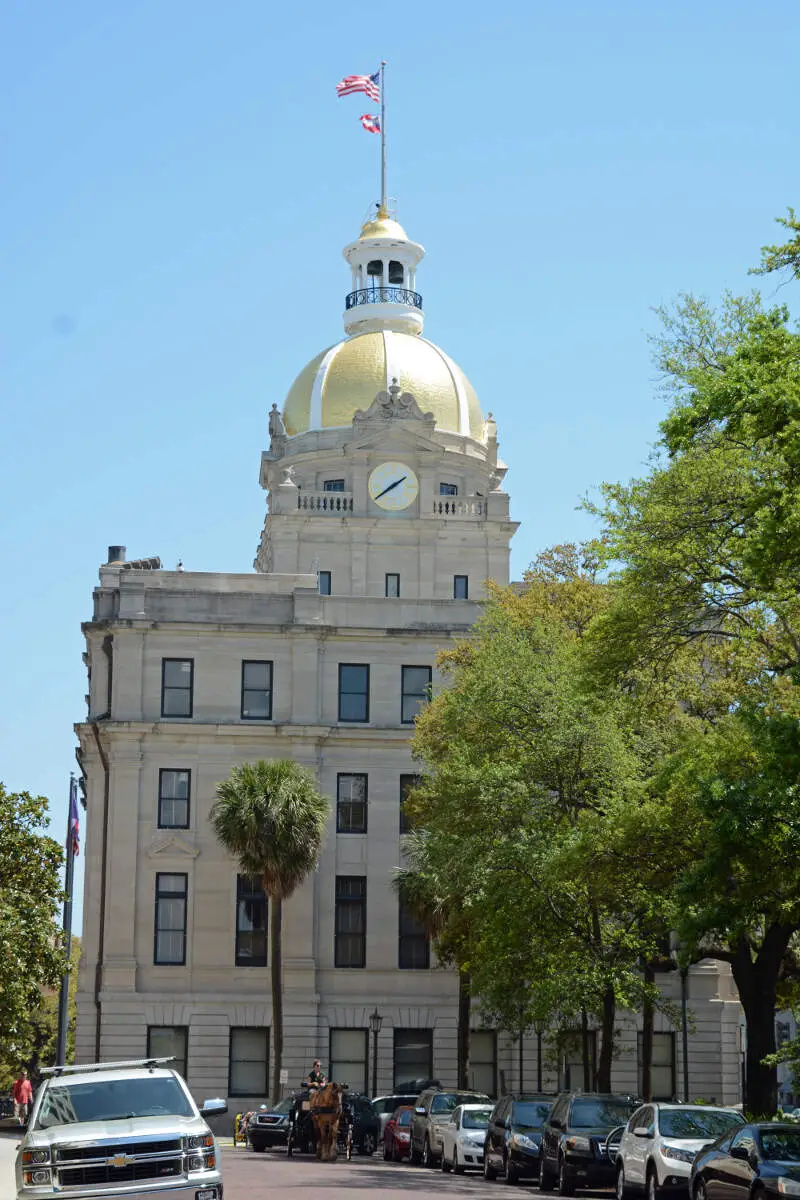
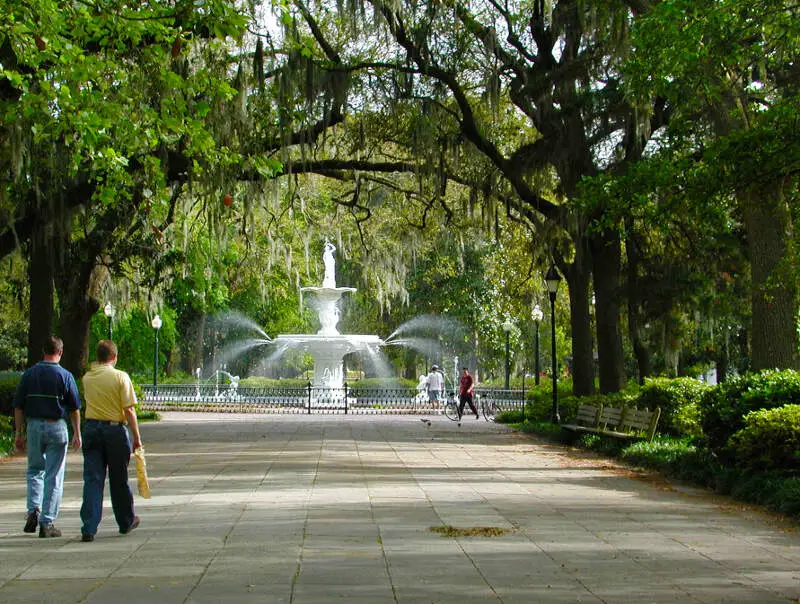
Savannah, GA Photos


10 Reviews & Comments About Savannah

I live in Georgia and I love it here!
I love waking up next to all of the farms!
I love going to the barrier islands!
Savannah is an amazing place!
Traffic and weather here s***s a lot tho.
There is a great Art college called Savannah College of Art and design that is the center of the city. The arts and culture are incredible. The city is Historic with a rich history. The architecture stands out unlike any other city. There is a Romance in the air in Savannah.
Great culinary experiences and wonderful history tours make this a great destination.
I took a bus tour of Savannah. It was such a beautiful place with the sweeping trees and the water nearby. Such a fun experience.
The trees and the water. Just completely beautiful place.
Savannah is a magical, quaint, and charming southern city. I fell in love with the amazing food, green spaces, art, and friendly hospitality of the locals. Prices are fair compared to other comparable cities in the US. I will certainly return.
Don't miss these amazing Savannah Experiences!
1. Go for a jog in Forsyth Park
2. Eat lunch at Mrs. Wilkes' Dining Room
3. Visit SCAD
4. Admire the architecture on Jones Street
5. Hop over to Tybee Island for a swim
The area is absolutely breathtaking. There is so much to do and a diverse population.
The local art and parks are amazing. I absolutely recommend the local parks.
I love Savannah. There's so much to do there like all of the super fun tours. I really enjoyed going on a haunted pub crawl.
The food everywhere was amazing. I really loved Paula Deen's Sunday brunch at her restaurant The Lady and Sons
I visited Savannah recently for a family member's wedding and absolutely adored the area.
The city was both historic while having a busy downtown area and quiet back roads. I felt like I had gone back in time when walking around the city streets.
I absolutely love visiting Savannah. Even though it is somewhat large it has a small town feel. Everyone is so friendly and welcoming. The town is very historical with beautiful architecture and buildings. It is so much fun to walk along the river and go into all the little shops. While in Savannah we are always sure to get some delicious seafood. One of the coolest things we did was go on a haunted ghost tour.
The Savannah College of Art and Design is also a very good school with some unique and great opportunities for students.
The thing that stands out the most about Savannah is the culture. Everywhere you look you see musicians or artists on the streets. Entertainment is everywhere and it is all beautiful.
I visited Savannah once back in 2006. I immediately fell in love with the atmosphere of it. There are beautiful neighborhoods with old Victorian houses. The beauty of it all simply swept me away. I enjoyed walking along the river shopping at the various shops and dining at the restaurants. I was only able to stay for a day, but that was long enough to land it on one of my top cities to visit again one day.
There is a place where you can go and sit on the same bench that Forest Gump sat in. The actual same bench from the movie. That was a pretty neat thing to be able to do.
I've lived in Georgia my entire life, I grew up in Savannah, later to move on to pooler and now Ellabell. I've been to most of these places and they're quiet & country. Everybodys friendly, just because we don't have a bunch of restaurants or stores, or malls etc doesn't mean they're crappy. I keep migrating further towards the country away from Savannah & life couldn't be better.
Basing things off population is rude, not everyone wants to live in a city with 70,000 people, my town MIGHT have 1-2 thousand people, this is a no stop light town the only food place we have is subway & grocery stores, the next city being Pembroke has a little more but if you ask me that town should've been first compared to Swainsboro.
Georgia is an awesome place to live and I would never think about leaving. I've been to many places up north and no offense but the people up north are much more rude & judgemental, you don't get that here.
Rankings & Articles For Savannah


Locations Around Savannah
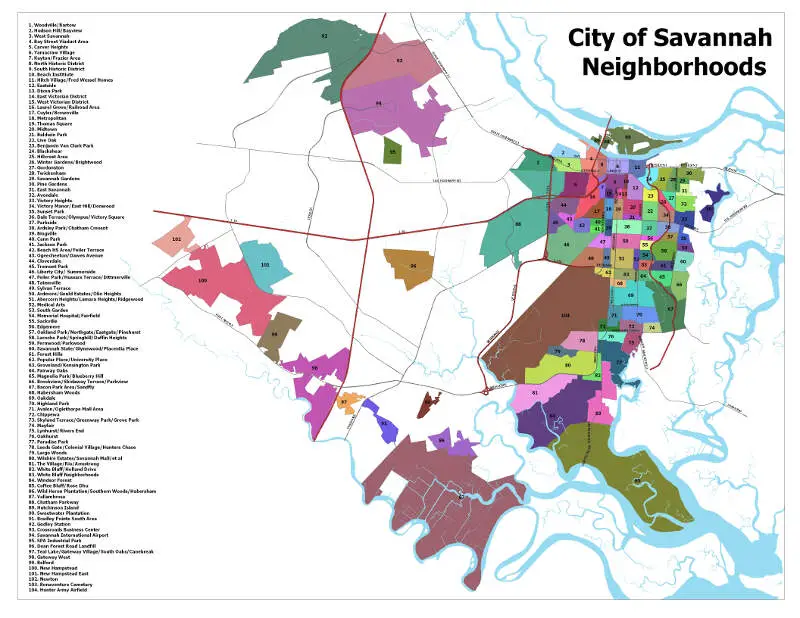
Map Of Savannah, GA
Best Places Around Savannah
Wilmington Island, GA
Population 13,905
Skidaway Island, GA
Population 9,315
Whitemarsh Island, GA
Population 6,886
Pooler, GA
Population 28,466
Georgetown, GA
Population 11,158
Richmond Hill, GA
Population 18,181
Port Wentworth, GA
Population 12,892
Bluffton, SC
Population 33,157
Savannah Demographics And Statistics
Population over time in Savannah
The current population in Savannah is 147,898. The population has increased 10.1% from 2010.
| Year | Population | % Change |
|---|---|---|
| 2024 | 147,898 | 0.2% |
| 2023 | 147,546 | -0.0% |
| 2022 | 147,583 | -0.2% |
| 2021 | 147,930 | 1.7% |
| 2020 | 145,492 | 0.1% |
| 2019 | 145,403 | 0.0% |
| 2018 | 145,342 | 0.2% |
| 2017 | 145,094 | 0.3% |
| 2016 | 144,717 | 1.3% |
| 2015 | 142,919 | 1.1% |
| 2014 | 141,298 | 1.2% |
| 2013 | 139,620 | 1.4% |
| 2012 | 137,690 | 1.4% |
| 2011 | 135,780 | 1.1% |
| 2010 | 134,348 | - |
Race / Ethnicity in Savannah
See the full breakdown
Savannah is:
34.6% White with 51,161 White residents.
50.9% African American with 75,238 African American residents.
0.0% American Indian with 73 American Indian residents.
2.9% Asian with 4,358 Asian residents.
0.1% Hawaiian with 116 Hawaiian residents.
0.5% Other with 801 Other residents.
3.4% Two Or More with 5,096 Two Or More residents.
7.5% Hispanic with 11,055 Hispanic residents.
| Race | Savannah | GA | USA |
|---|---|---|---|
| White | 34.6% | 49.1% | 57.4% |
| African American | 50.9% | 30.7% | 11.9% |
| American Indian | 0.0% | 0.1% | 0.5% |
| Asian | 2.9% | 4.5% | 5.9% |
| Hawaiian | 0.1% | 0.1% | 0.2% |
| Other | 0.5% | 0.6% | 0.6% |
| Two Or More | 3.4% | 3.9% | 4.3% |
| Hispanic | 7.5% | 11.0% | 19.3% |
Gender in Savannah
See the full breakdown
Savannah is 52.8% female with 78,148 female residents.
Savannah is 47.2% male with 69,750 male residents.
| Gender | Savannah | GA | USA |
|---|---|---|---|
| Female | 52.8% | 51.2% | 50.5% |
| Male | 47.2% | 48.8% | 49.5% |
Highest level of educational attainment in Savannah for adults over 25
See the full breakdown
4.0% of adults in Savannah completed < 9th grade.
7.0% of adults in Savannah completed 9-12th grade.
26.0% of adults in Savannah completed high school / ged.
23.0% of adults in Savannah completed some college.
7.0% of adults in Savannah completed associate's degree.
21.0% of adults in Savannah completed bachelor's degree.
9.0% of adults in Savannah completed master's degree.
2.0% of adults in Savannah completed professional degree.
1.0% of adults in Savannah completed doctorate degree.
| Education | Savannah | GA | USA |
|---|---|---|---|
| < 9th Grade | 4.0% | 4.0% | 4.0% |
| 9-12th Grade | 7.0% | 7.0% | 6.0% |
| High School / GED | 26.0% | 27.0% | 26.0% |
| Some College | 23.0% | 19.0% | 19.0% |
| Associate's Degree | 7.0% | 8.0% | 9.0% |
| Bachelor's Degree | 21.0% | 21.0% | 22.0% |
| Master's Degree | 9.0% | 10.0% | 10.0% |
| Professional Degree | 2.0% | 2.0% | 2.0% |
| Doctorate Degree | 1.0% | 2.0% | 2.0% |
Household Income For Savannah, Georgia
See the full breakdown
8.1% of households in Savannah earn Less than $10,000.
4.9% of households in Savannah earn $10,000 to $14,999.
8.1% of households in Savannah earn $15,000 to $24,999.
9.6% of households in Savannah earn $25,000 to $34,999.
13.0% of households in Savannah earn $35,000 to $49,999.
18.3% of households in Savannah earn $50,000 to $74,999.
11.8% of households in Savannah earn $75,000 to $99,999.
14.6% of households in Savannah earn $100,000 to $149,999.
5.7% of households in Savannah earn $150,000 to $199,999.
6.0% of households in Savannah earn $200,000 or more.
| Income | Savannah | GA | USA |
|---|---|---|---|
| Less than $10,000 | 8.1% | 5.4% | 5.0% |
| $10,000 to $14,999 | 4.9% | 3.4% | 3.4% |
| $15,000 to $24,999 | 8.1% | 6.6% | 6.3% |
| $25,000 to $34,999 | 9.6% | 6.8% | 6.6% |
| $35,000 to $49,999 | 13.0% | 10.7% | 10.1% |
| $50,000 to $74,999 | 18.3% | 15.9% | 15.5% |
| $75,000 to $99,999 | 11.8% | 13.0% | 12.6% |
| $100,000 to $149,999 | 14.6% | 17.3% | 17.5% |
| $150,000 to $199,999 | 5.7% | 9.2% | 9.6% |
| $200,000 or more | 6.0% | 11.9% | 13.4% |
Source: U.S. Census ACS 5-year estimates (2024)


