Bluffton SnackAbility
Overall SnackAbility
Crime in Bluffton summary. We use data from the FBI to determine the crime rates in Bluffton. Key points include:
There were 358 total crimes in Bluffton in the last reporting year.
The overall crime rate per 100,000 people in Bluffton is 943.9 / 100k people.
The violent crime rate per 100,000 people in Bluffton is 118.6 / 100k people.
The property crime rate per 100,000 people in Bluffton is 825.3 / 100k people.
Overall, crime in Bluffton is -55.46% below the national average.
Total Crimes
Below National Average
Crime In Bluffton Comparison Table
| Statistic | Count Raw |
Bluffton / 100k People |
South Carolina / 100k People |
National / 100k People |
|---|---|---|---|---|
| Total Crimes Per 100K | 358 | 943.9 | 2,402.5 | 2,119.2 |
| Violent Crime | 45 | 118.6 | 436.7 | 359.0 |
| Murder | 2 | 5.3 | 7.5 | 5.0 |
| Robbery | 8 | 21.1 | 35.1 | 61.0 |
| Aggravated Assault | 29 | 76.5 | 357.1 | 256.0 |
| Property Crime | 313 | 825.3 | 1,965.8 | 1,760.0 |
| Burglary | 26 | 68.6 | 282.4 | 229.0 |
| Larceny | 258 | 680.3 | 1,468.2 | 1,272.0 |
| Car Theft | 29 | 76.5 | 215.1 | 259.0 |
Source: FBI Uniform Crime Reporting (2024)
Cost of living in Bluffton summary. We use data on the cost of living to determine how expensive it is to live in Bluffton. Real estate prices drive most of the variance in cost of living around South Carolina. Key points include:
The cost of living in Bluffton is 120 with 100 being average.
The cost of living in Bluffton is 1.2x higher than the national average.
The median home value in Bluffton is $498,492.
The median income in Bluffton is $111,281.
Bluffton's Overall Cost Of Living
Higher Than The National Average
Cost Of Living In Bluffton Comparison Table
| Living Expense | Bluffton | South Carolina | National Average |
|---|---|---|---|
| Overall | 120 | 92 | 100 |
| Services | 97 | 97 | 100 |
| Groceries | 94 | 96 | 100 |
| Health | 171 | 82 | 100 |
| Housing | 100 | 101 | 100 |
| Transportation | 105 | 101 | 100 |
| Utilities | 101 | 97 | 100 |
Source: Cost of living index, normalized to US average = 100
Bluffton, SC Weather
The average high in Bluffton is 76.7° and the average low is 56.1°.
There are 74.3 days of precipitation each year.
Expect an average of 49.7 inches of precipitation each year with 0.2 inches of snow.
| Stat | Bluffton |
|---|---|
| Average Annual High | 76.7 |
| Average Annual Low | 56.1 |
| Annual Precipitation Days | 74.3 |
| Average Annual Precipitation | 49.7 |
| Average Annual Snowfall | 0.2 |
Average High
Days of Rain
Source: NOAA climate normals (30-year)
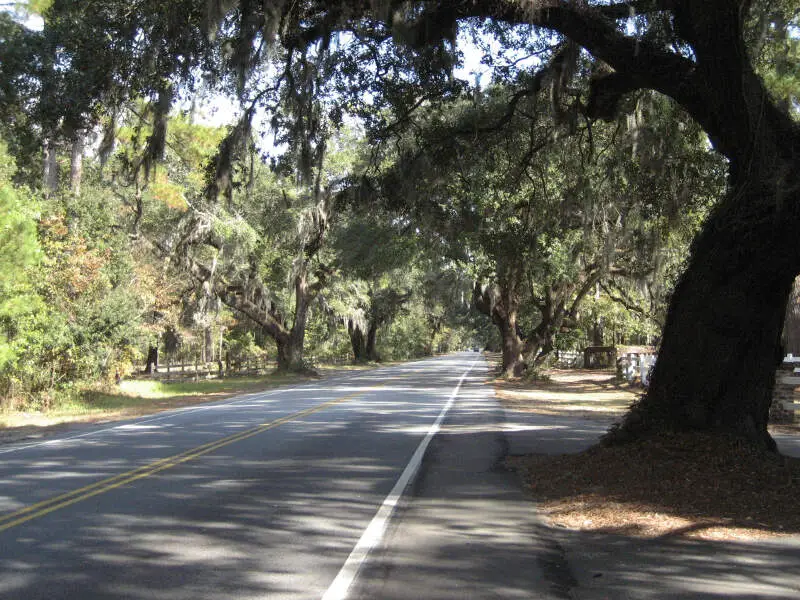
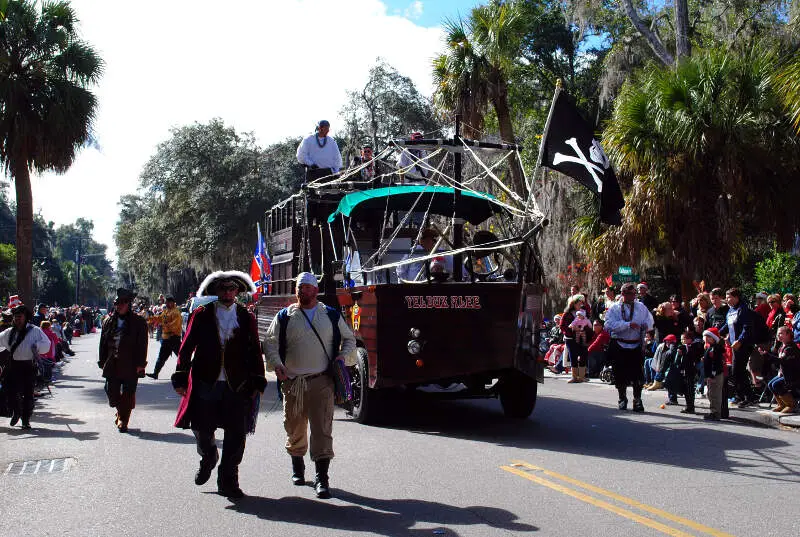
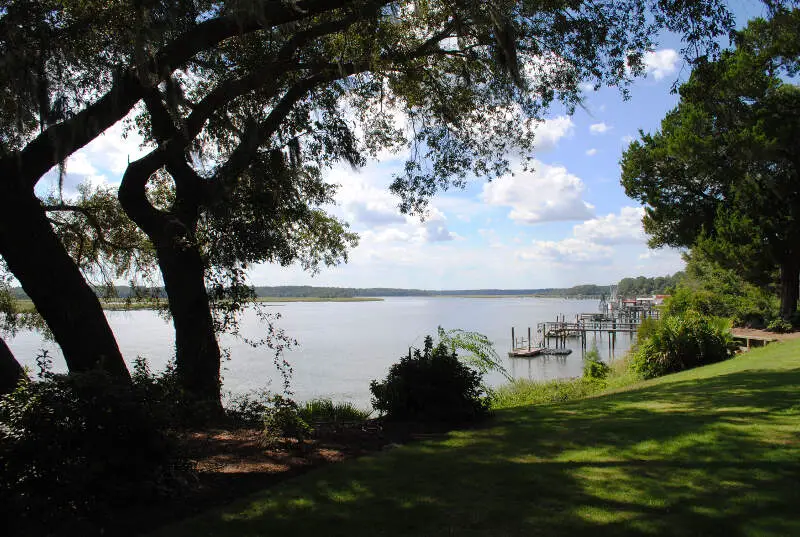
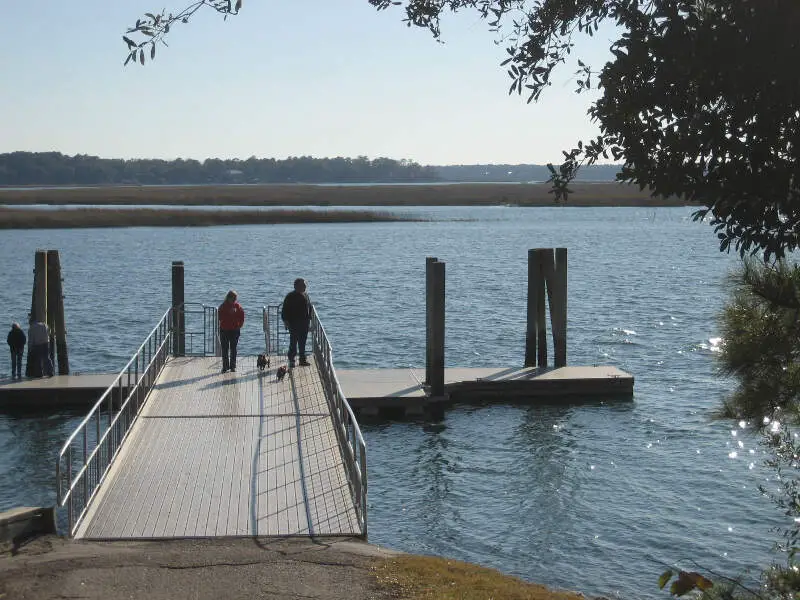
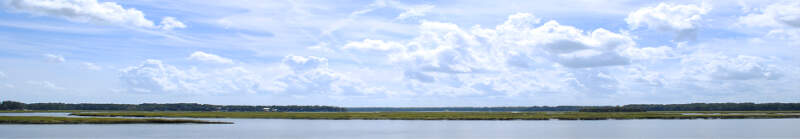
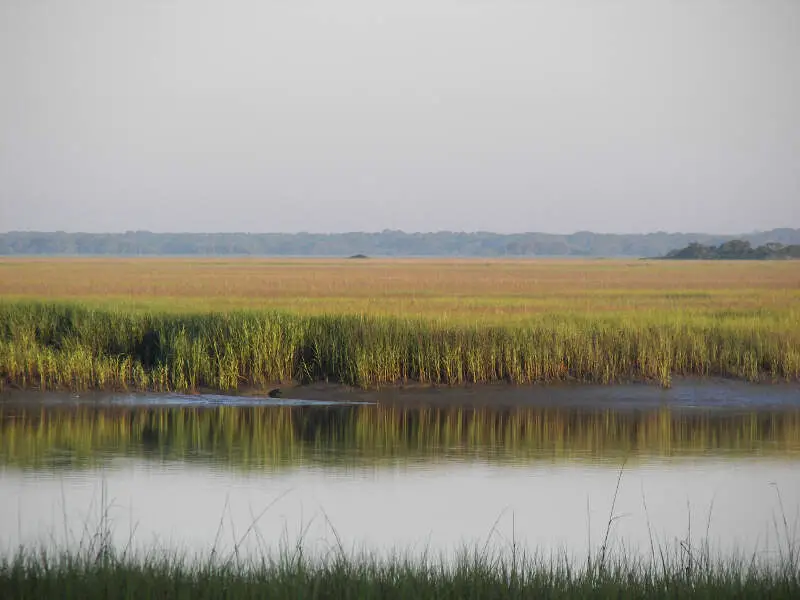
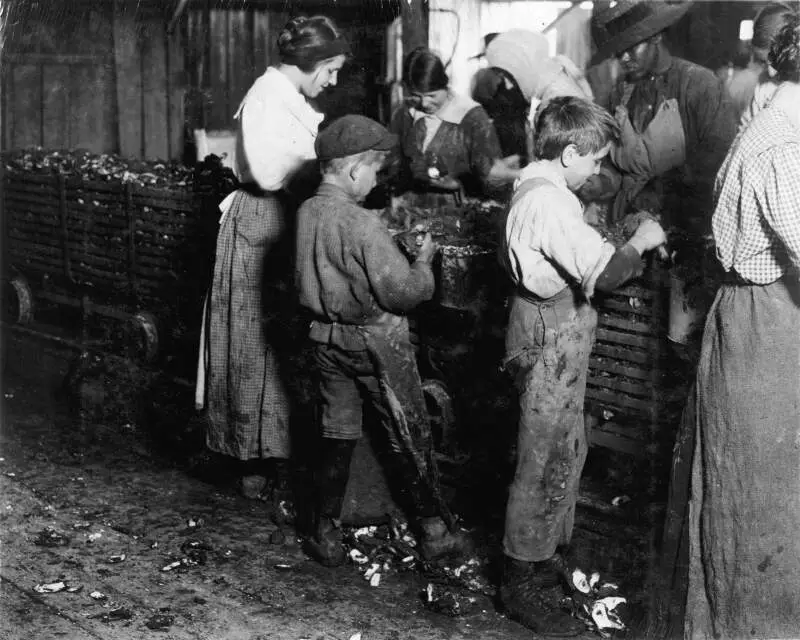
Bluffton, SC Photos

2 Reviews & Comments About Bluffton

Bluffton is a coastal community with a very rich history. It's just a few minutes drive from Hilton Head Island and not much further to drive to Savannah GA. The weather is just about perfect year round. The people are friendly, kind, and genuine. There is a fantastic artists colony here in Old Town Bluffton and there are more restaurants than you could get to in a year. The life style is centered around the outdoors and there is never of lack of things to do. The growth is amazing here, more people moving in every day, and businesses being built and opened constantly. If you want to work there is always somewhere that will hire you.
Old Town Bluffton is historic, beautiful and full of small artists studios to browse in.
Bluffton is a wonderful place to live or just visit. The people are friendly and helpful. Everyone is warm and welcoming. There is so much to do and see here. There is an artist's colony in Old Town with dozens of small galleries. The food is southern, but so diverse, and includes everything from BBQ to French pastries. It's just a 20 minute drive south to beautiful Savannah GA or head east to spend the day at the beaches on gorgeous Hilton Head Island.
Old Town Bluffton, for the art exhibits and the history of the area.
Rankings & Articles For Bluffton


Locations Around Bluffton
Map Of Bluffton, SC
Best Places Around Bluffton
Wilmington Island, GA
Population 13,905
Skidaway Island, GA
Population 9,315
Whitemarsh Island, GA
Population 6,886
Port Wentworth, GA
Population 12,892
Hilton Head Island, SC
Population 37,911
Savannah, GA
Population 147,898
Port Royal, SC
Population 15,579
Burton, SC
Population 6,912
Laurel Bay, SC
Population 5,882
Bluffton Demographics And Statistics
Population over time in Bluffton
The current population in Bluffton is 33,157. The population has increased 208.5% from 2010.
| Year | Population | % Change |
|---|---|---|
| 2024 | 33,157 | 5.9% |
| 2023 | 31,323 | 6.6% |
| 2022 | 29,375 | 6.4% |
| 2021 | 27,596 | 19.1% |
| 2020 | 23,176 | 11.4% |
| 2019 | 20,799 | 10.4% |
| 2018 | 18,835 | 9.7% |
| 2017 | 17,164 | 8.9% |
| 2016 | 15,765 | 7.9% |
| 2015 | 14,607 | 4.5% |
| 2014 | 13,979 | 7.8% |
| 2013 | 12,972 | 6.5% |
| 2012 | 12,186 | 5.5% |
| 2011 | 11,547 | 7.4% |
| 2010 | 10,748 | - |
Race / Ethnicity in Bluffton
See the full breakdown
Bluffton is:
74.8% White with 24,791 White residents.
9.0% African American with 2,984 African American residents.
0.0% American Indian with 4 American Indian residents.
1.4% Asian with 478 Asian residents.
0.0% Hawaiian with 0 Hawaiian residents.
1.0% Other with 332 Other residents.
3.3% Two Or More with 1,097 Two Or More residents.
10.5% Hispanic with 3,471 Hispanic residents.
| Race | Bluffton | SC | USA |
|---|---|---|---|
| White | 74.8% | 61.9% | 57.4% |
| African American | 9.0% | 24.6% | 11.9% |
| American Indian | 0.0% | 0.2% | 0.5% |
| Asian | 1.4% | 1.7% | 5.9% |
| Hawaiian | 0.0% | 0.0% | 0.2% |
| Other | 1.0% | 0.5% | 0.6% |
| Two Or More | 3.3% | 3.7% | 4.3% |
| Hispanic | 10.5% | 7.4% | 19.3% |
Gender in Bluffton
See the full breakdown
Bluffton is 50.6% female with 16,776 female residents.
Bluffton is 49.4% male with 16,380 male residents.
| Gender | Bluffton | SC | USA |
|---|---|---|---|
| Female | 50.6% | 51.3% | 50.5% |
| Male | 49.4% | 48.7% | 49.5% |
Highest level of educational attainment in Bluffton for adults over 25
See the full breakdown
0.0% of adults in Bluffton completed < 9th grade.
2.0% of adults in Bluffton completed 9-12th grade.
13.0% of adults in Bluffton completed high school / ged.
23.0% of adults in Bluffton completed some college.
9.0% of adults in Bluffton completed associate's degree.
31.0% of adults in Bluffton completed bachelor's degree.
17.0% of adults in Bluffton completed master's degree.
3.0% of adults in Bluffton completed professional degree.
2.0% of adults in Bluffton completed doctorate degree.
| Education | Bluffton | SC | USA |
|---|---|---|---|
| < 9th Grade | 0.0% | 3.0% | 4.0% |
| 9-12th Grade | 2.0% | 7.0% | 6.0% |
| High School / GED | 13.0% | 28.0% | 26.0% |
| Some College | 23.0% | 20.0% | 19.0% |
| Associate's Degree | 9.0% | 10.0% | 9.0% |
| Bachelor's Degree | 31.0% | 20.0% | 22.0% |
| Master's Degree | 17.0% | 9.0% | 10.0% |
| Professional Degree | 3.0% | 2.0% | 2.0% |
| Doctorate Degree | 2.0% | 1.0% | 2.0% |
Household Income For Bluffton, South Carolina
See the full breakdown
3.1% of households in Bluffton earn Less than $10,000.
1.0% of households in Bluffton earn $10,000 to $14,999.
2.0% of households in Bluffton earn $15,000 to $24,999.
2.6% of households in Bluffton earn $25,000 to $34,999.
6.6% of households in Bluffton earn $35,000 to $49,999.
11.6% of households in Bluffton earn $50,000 to $74,999.
16.6% of households in Bluffton earn $75,000 to $99,999.
25.4% of households in Bluffton earn $100,000 to $149,999.
11.1% of households in Bluffton earn $150,000 to $199,999.
20.0% of households in Bluffton earn $200,000 or more.
| Income | Bluffton | SC | USA |
|---|---|---|---|
| Less than $10,000 | 3.1% | 5.9% | 5.0% |
| $10,000 to $14,999 | 1.0% | 3.8% | 3.4% |
| $15,000 to $24,999 | 2.0% | 7.3% | 6.3% |
| $25,000 to $34,999 | 2.6% | 7.7% | 6.6% |
| $35,000 to $49,999 | 6.6% | 11.9% | 10.1% |
| $50,000 to $74,999 | 11.6% | 17.0% | 15.5% |
| $75,000 to $99,999 | 16.6% | 13.1% | 12.6% |
| $100,000 to $149,999 | 25.4% | 16.4% | 17.5% |
| $150,000 to $199,999 | 11.1% | 8.0% | 9.6% |
| $200,000 or more | 20.0% | 8.9% | 13.4% |
Source: U.S. Census ACS 5-year estimates (2024)


