Snellville SnackAbility
Overall SnackAbility
Crime in Snellville summary. We use data from the FBI to determine the crime rates in Snellville. Key points include:
There were 510 total crimes in Snellville in the last reporting year.
The overall crime rate per 100,000 people in Snellville is 2,258.0 / 100k people.
The violent crime rate per 100,000 people in Snellville is 186.0 / 100k people.
The property crime rate per 100,000 people in Snellville is 2,072.1 / 100k people.
Overall, crime in Snellville is 6.55% above the national average.
Total Crimes
Above National Average
Crime In Snellville Comparison Table
| Statistic | Count Raw |
Snellville / 100k People |
Georgia / 100k People |
National / 100k People |
|---|---|---|---|---|
| Total Crimes Per 100K | 510 | 2,258.0 | 2,000.6 | 2,119.2 |
| Violent Crime | 42 | 186.0 | 325.7 | 359.0 |
| Murder | 1 | 4.4 | 6.9 | 5.0 |
| Robbery | 8 | 35.4 | 40.8 | 61.0 |
| Aggravated Assault | 28 | 124.0 | 245.9 | 256.0 |
| Property Crime | 468 | 2,072.1 | 1,674.9 | 1,760.0 |
| Burglary | 20 | 88.6 | 202.8 | 229.0 |
| Larceny | 411 | 1,819.7 | 1,247.3 | 1,272.0 |
| Car Theft | 37 | 163.8 | 224.7 | 259.0 |
Source: FBI Uniform Crime Reporting (2024)
Cost of living in Snellville summary. We use data on the cost of living to determine how expensive it is to live in Snellville. Real estate prices drive most of the variance in cost of living around Georgia. Key points include:
The cost of living in Snellville is 105 with 100 being average.
The cost of living in Snellville is 1.1x higher than the national average.
The median home value in Snellville is $355,607.
The median income in Snellville is $89,896.
Snellville's Overall Cost Of Living
Higher Than The National Average
Cost Of Living In Snellville Comparison Table
| Living Expense | Snellville | Georgia | National Average |
|---|---|---|---|
| Overall | 105 | 95 | 100 |
| Services | 98 | 97 | 100 |
| Groceries | 99 | 99 | 100 |
| Health | 118 | 88 | 100 |
| Housing | 101 | 101 | 100 |
| Transportation | 101 | 104 | 100 |
| Utilities | 98 | 101 | 100 |
Source: Cost of living index, normalized to US average = 100
Snellville, GA Weather
The average high in Snellville is 71.5° and the average low is 50.5°.
There are 80.7 days of precipitation each year.
Expect an average of 51.2 inches of precipitation each year with 0.8 inches of snow.
| Stat | Snellville |
|---|---|
| Average Annual High | 71.5 |
| Average Annual Low | 50.5 |
| Annual Precipitation Days | 80.7 |
| Average Annual Precipitation | 51.2 |
| Average Annual Snowfall | 0.8 |
Average High
Days of Rain
Source: NOAA climate normals (30-year)
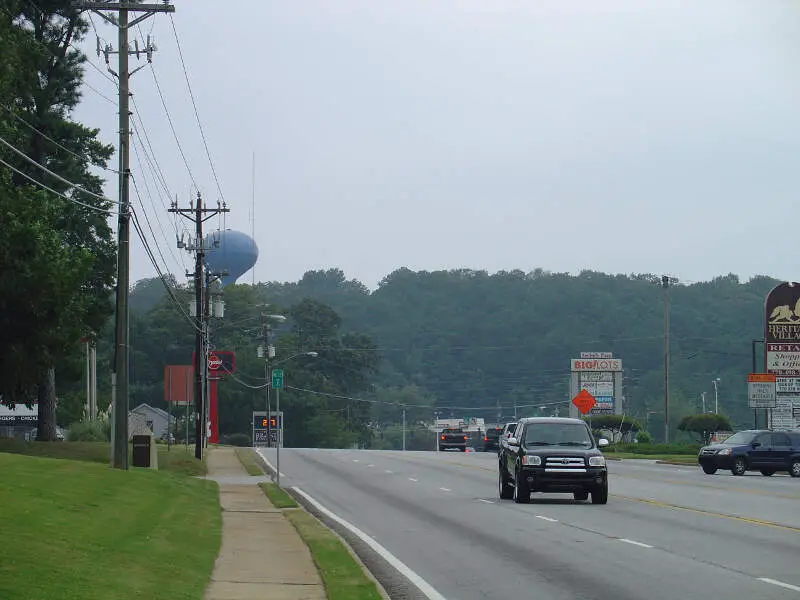
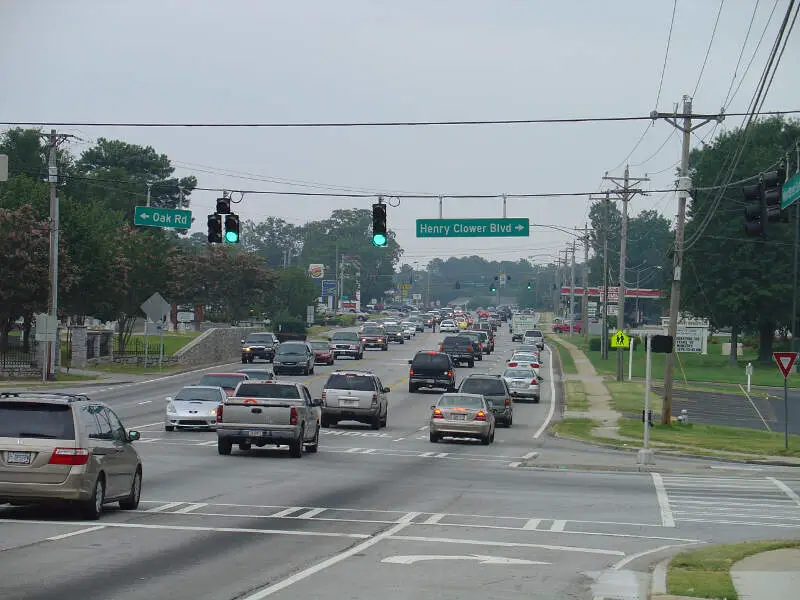
Snellville, GA Photos


1 Reviews & Comments About Snellville

Snellville has a lot of good businesses and is usually a really decent place to shop but Kohls is one of the worst! I was taking some items back that I previously bought online and the store employee was very rude and disrespectful. Not only did she cause a scene, but she refused to explain to me what Kohls cash was.
The employee's attitudes were awful. Snellville also has a lot of crime and home invasions that tend to happen more than often.
Rankings & Articles For Snellville


Locations Around Snellville
Map Of Snellville, GA
Best Places Around Snellville
Mountain Park, GA
Population 12,850
Johns Creek, GA
Population 81,988
Decatur, GA
Population 24,518
Suwanee, GA
Population 22,349
Duluth, GA
Population 32,426
Sugar Hill, GA
Population 26,128
Druid Hills, GA
Population 8,169
Dunwoody, GA
Population 51,758
North Decatur, GA
Population 18,442
Snellville Demographics And Statistics
Population over time in Snellville
The current population in Snellville is 21,620. The population has increased 18.3% from 2010.
| Year | Population | % Change |
|---|---|---|
| 2024 | 21,620 | 2.0% |
| 2023 | 21,203 | 1.5% |
| 2022 | 20,895 | 2.1% |
| 2021 | 20,475 | 2.8% |
| 2020 | 19,923 | 0.7% |
| 2019 | 19,778 | 0.7% |
| 2018 | 19,631 | 0.6% |
| 2017 | 19,521 | 0.6% |
| 2016 | 19,395 | 1.0% |
| 2015 | 19,199 | 1.4% |
| 2014 | 18,939 | 1.2% |
| 2013 | 18,707 | 0.9% |
| 2012 | 18,540 | 0.9% |
| 2011 | 18,373 | 0.5% |
| 2010 | 18,276 | - |
Race / Ethnicity in Snellville
See the full breakdown
Snellville is:
31.2% White with 6,754 White residents.
39.9% African American with 8,631 African American residents.
0.1% American Indian with 13 American Indian residents.
10.5% Asian with 2,280 Asian residents.
0.0% Hawaiian with 2 Hawaiian residents.
0.3% Other with 58 Other residents.
2.3% Two Or More with 491 Two Or More residents.
15.7% Hispanic with 3,391 Hispanic residents.
| Race | Snellville | GA | USA |
|---|---|---|---|
| White | 31.2% | 49.1% | 57.4% |
| African American | 39.9% | 30.7% | 11.9% |
| American Indian | 0.1% | 0.1% | 0.5% |
| Asian | 10.5% | 4.5% | 5.9% |
| Hawaiian | 0.0% | 0.1% | 0.2% |
| Other | 0.3% | 0.6% | 0.6% |
| Two Or More | 2.3% | 3.9% | 4.3% |
| Hispanic | 15.7% | 11.0% | 19.3% |
Gender in Snellville
See the full breakdown
Snellville is 56.1% female with 12,124 female residents.
Snellville is 43.9% male with 9,496 male residents.
| Gender | Snellville | GA | USA |
|---|---|---|---|
| Female | 56.1% | 51.2% | 50.5% |
| Male | 43.9% | 48.8% | 49.5% |
Highest level of educational attainment in Snellville for adults over 25
See the full breakdown
5.0% of adults in Snellville completed < 9th grade.
5.0% of adults in Snellville completed 9-12th grade.
28.0% of adults in Snellville completed high school / ged.
17.0% of adults in Snellville completed some college.
9.0% of adults in Snellville completed associate's degree.
26.0% of adults in Snellville completed bachelor's degree.
8.0% of adults in Snellville completed master's degree.
1.0% of adults in Snellville completed professional degree.
1.0% of adults in Snellville completed doctorate degree.
| Education | Snellville | GA | USA |
|---|---|---|---|
| < 9th Grade | 5.0% | 4.0% | 4.0% |
| 9-12th Grade | 5.0% | 7.0% | 6.0% |
| High School / GED | 28.0% | 27.0% | 26.0% |
| Some College | 17.0% | 19.0% | 19.0% |
| Associate's Degree | 9.0% | 8.0% | 9.0% |
| Bachelor's Degree | 26.0% | 21.0% | 22.0% |
| Master's Degree | 8.0% | 10.0% | 10.0% |
| Professional Degree | 1.0% | 2.0% | 2.0% |
| Doctorate Degree | 1.0% | 2.0% | 2.0% |
Household Income For Snellville, Georgia
See the full breakdown
3.8% of households in Snellville earn Less than $10,000.
3.3% of households in Snellville earn $10,000 to $14,999.
3.5% of households in Snellville earn $15,000 to $24,999.
3.1% of households in Snellville earn $25,000 to $34,999.
5.9% of households in Snellville earn $35,000 to $49,999.
20.1% of households in Snellville earn $50,000 to $74,999.
15.6% of households in Snellville earn $75,000 to $99,999.
21.5% of households in Snellville earn $100,000 to $149,999.
13.4% of households in Snellville earn $150,000 to $199,999.
9.9% of households in Snellville earn $200,000 or more.
| Income | Snellville | GA | USA |
|---|---|---|---|
| Less than $10,000 | 3.8% | 5.4% | 5.0% |
| $10,000 to $14,999 | 3.3% | 3.4% | 3.4% |
| $15,000 to $24,999 | 3.5% | 6.6% | 6.3% |
| $25,000 to $34,999 | 3.1% | 6.8% | 6.6% |
| $35,000 to $49,999 | 5.9% | 10.7% | 10.1% |
| $50,000 to $74,999 | 20.1% | 15.9% | 15.5% |
| $75,000 to $99,999 | 15.6% | 13.0% | 12.6% |
| $100,000 to $149,999 | 21.5% | 17.3% | 17.5% |
| $150,000 to $199,999 | 13.4% | 9.2% | 9.6% |
| $200,000 or more | 9.9% | 11.9% | 13.4% |
Source: U.S. Census ACS 5-year estimates (2024)


