Compare Boulder to…
Boulder SnackAbility
Overall SnackAbility
Crime in Boulder summary. We use data from the FBI to determine the crime rates in Boulder. Key points include:
There were 3,214 total crimes in Boulder in the last reporting year.
The overall crime rate per 100,000 people in Boulder is 3,055.3 / 100k people.
The violent crime rate per 100,000 people in Boulder is 322.3 / 100k people.
The property crime rate per 100,000 people in Boulder is 2,733.0 / 100k people.
Overall, crime in Boulder is 44.17% above the national average.
Total Crimes
Above National Average
Crime In Boulder Comparison Table
| Statistic | Count Raw |
Boulder / 100k People |
Colorado / 100k People |
National / 100k People |
|---|---|---|---|---|
| Total Crimes Per 100K | 3,214 | 3,055.3 | 3,069.1 | 2,119.2 |
| Violent Crime | 339 | 322.3 | 476.3 | 359.0 |
| Murder | 0 | 0.0 | 4.5 | 5.0 |
| Robbery | 47 | 44.7 | 63.0 | 61.0 |
| Aggravated Assault | 255 | 242.4 | 350.5 | 256.0 |
| Property Crime | 2,875 | 2,733.0 | 2,592.8 | 1,760.0 |
| Burglary | 403 | 383.1 | 348.0 | 229.0 |
| Larceny | 2,253 | 2,141.7 | 1,754.2 | 1,272.0 |
| Car Theft | 219 | 208.2 | 490.6 | 259.0 |
Source: FBI Uniform Crime Reporting (2024)
Cost of living in Boulder summary. We use data on the cost of living to determine how expensive it is to live in Boulder. Real estate prices drive most of the variance in cost of living around Colorado. Key points include:
The cost of living in Boulder is 176 with 100 being average.
The cost of living in Boulder is 1.8x higher than the national average.
The median home value in Boulder is $964,530.
The median income in Boulder is $87,493.
Boulder's Overall Cost Of Living
Higher Than The National Average
Cost Of Living In Boulder Comparison Table
| Living Expense | Boulder | Colorado | National Average |
|---|---|---|---|
| Overall | 176 | 114 | 100 |
| Services | 106 | 104 | 100 |
| Groceries | 105 | 107 | 100 |
| Health | 332 | 135 | 100 |
| Housing | 106 | 104 | 100 |
| Transportation | 108 | 107 | 100 |
| Utilities | 115 | 107 | 100 |
Source: Cost of living index, normalized to US average = 100
Boulder, CO Weather
The average high in Boulder is 61.7° and the average low is 33.9°.
There are 46.6 days of precipitation each year.
Expect an average of 18.6 inches of precipitation each year with 88.7 inches of snow.
| Stat | Boulder |
|---|---|
| Average Annual High | 61.7 |
| Average Annual Low | 33.9 |
| Annual Precipitation Days | 46.6 |
| Average Annual Precipitation | 18.6 |
| Average Annual Snowfall | 88.7 |
Average High
Days of Rain
Source: NOAA climate normals (30-year)
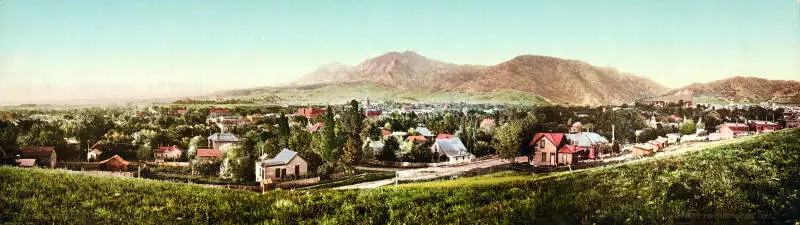
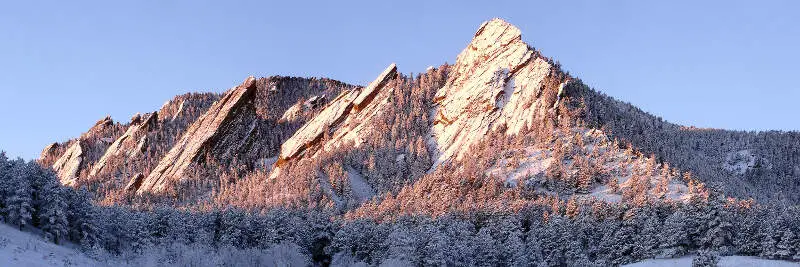
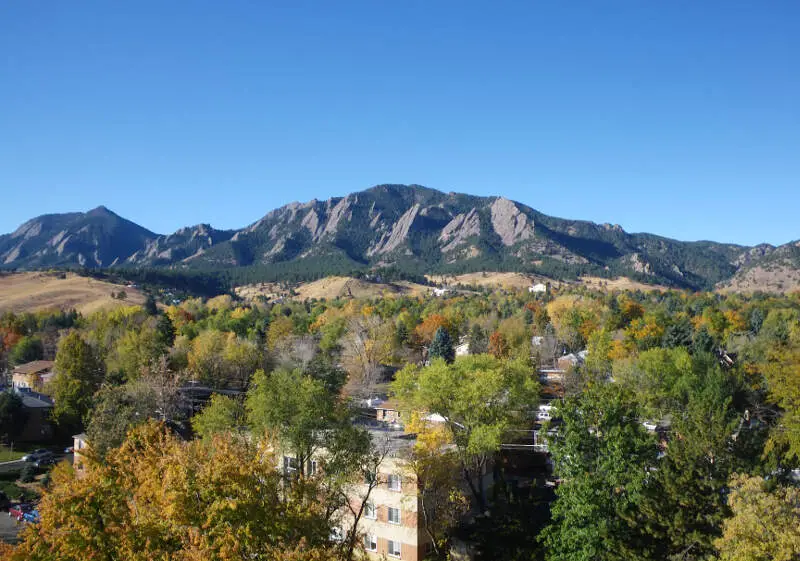
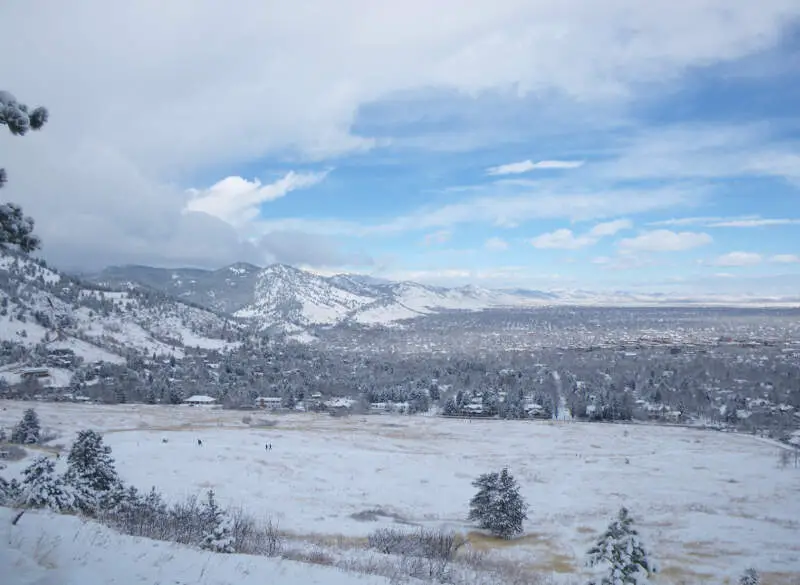
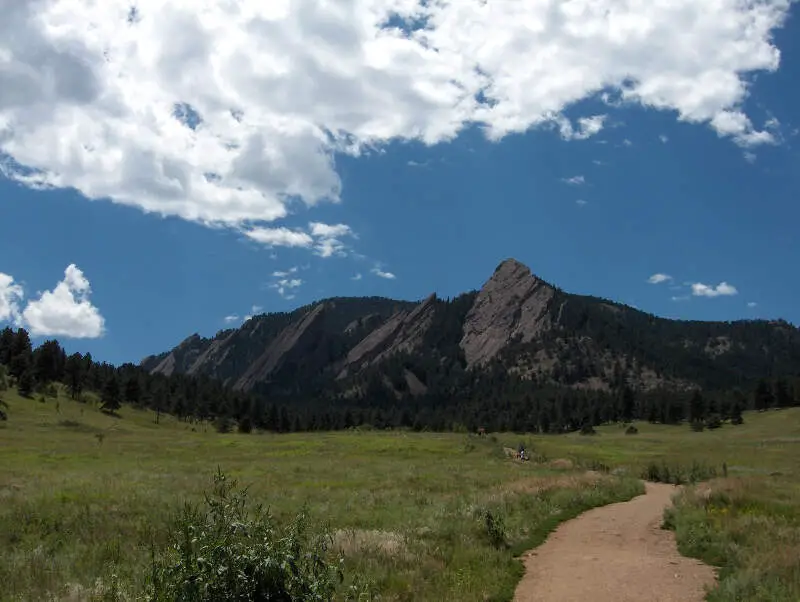
Boulder, CO Photos

1 Reviews & Comments About Boulder

Boulder is a very unique place - lots of liberal idealism. People live in a somewhat unrealistic world where everyone is equal, everything will be fair if you just fight hard enough, and a gallon of milk is supposed to cost $5. The crime is relatively low, marijuana and drug use is extremely high, and the public school system is fantastic. Architecture and art are incredible; social scene and activities are plentiful - there is always something to do or something to see.
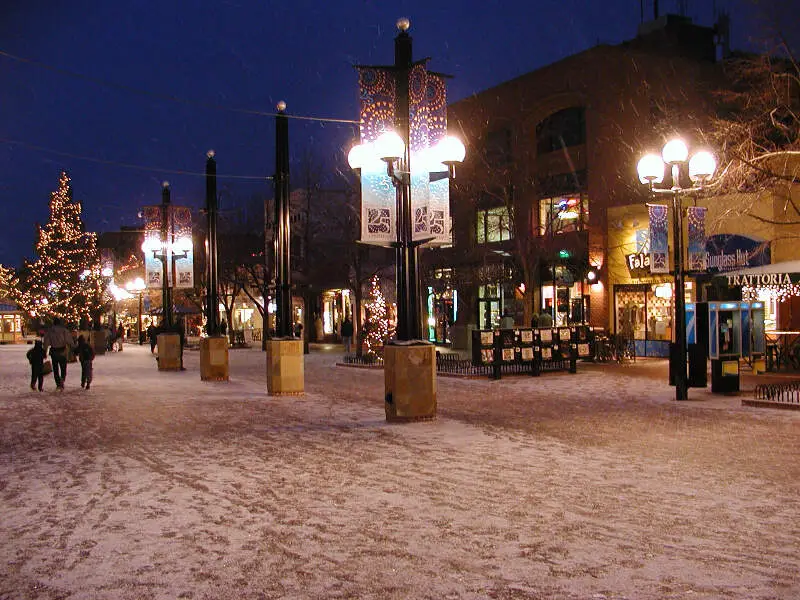
Pearl Street Mall and all of Downtown Boulder is extremely fun, hip, and fast-paced. However, this is also where almost all of the homeless population resides. The Boulder Reservoir has a great swim beach and is fantastic for killing a few hours during the summer. Hiking trails abound, Chatauqua Park is a great option with trails of varying difficulty for any hiker.
Rankings & Articles For Boulder


Locations Around Boulder
Map Of Boulder, CO
Best Places Around Boulder
Federal Heights, CO
Population 14,125
Berkley, CO
Population 10,789
Welby, CO
Population 16,197
Sherrelwood, CO
Population 18,692
Firestone, CO
Population 18,049
Wheat Ridge, CO
Population 32,070
Golden, CO
Population 20,417
Northglenn, CO
Population 38,014
Frederick, CO
Population 16,651
Westminster, CO
Population 115,484
Boulder Demographics And Statistics
Population over time in Boulder
The current population in Boulder is 106,433. The population has increased 9.7% from 2010.
| Year | Population | % Change |
|---|---|---|
| 2024 | 106,433 | 0.1% |
| 2023 | 106,274 | -0.3% |
| 2022 | 106,598 | 1.6% |
| 2021 | 104,930 | -3.5% |
| 2020 | 108,777 | 2.2% |
| 2019 | 106,392 | -0.9% |
| 2018 | 107,360 | 1.0% |
| 2017 | 106,271 | 0.8% |
| 2016 | 105,420 | 1.4% |
| 2015 | 103,919 | 1.9% |
| 2014 | 102,002 | 1.6% |
| 2013 | 100,363 | 1.2% |
| 2012 | 99,177 | 1.7% |
| 2011 | 97,565 | 0.5% |
| 2010 | 97,050 | - |
Race / Ethnicity in Boulder
See the full breakdown
Boulder is:
78.0% White with 83,051 White residents.
1.0% African American with 1,050 African American residents.
0.2% American Indian with 240 American Indian residents.
5.4% Asian with 5,740 Asian residents.
0.0% Hawaiian with 52 Hawaiian residents.
0.3% Other with 301 Other residents.
4.4% Two Or More with 4,631 Two Or More residents.
10.7% Hispanic with 11,368 Hispanic residents.
| Race | Boulder | CO | USA |
|---|---|---|---|
| White | 78.0% | 64.8% | 57.4% |
| African American | 1.0% | 3.8% | 11.9% |
| American Indian | 0.2% | 0.4% | 0.5% |
| Asian | 5.4% | 3.2% | 5.9% |
| Hawaiian | 0.0% | 0.1% | 0.2% |
| Other | 0.3% | 0.5% | 0.6% |
| Two Or More | 4.4% | 4.6% | 4.3% |
| Hispanic | 10.7% | 22.5% | 19.3% |
Gender in Boulder
See the full breakdown
Boulder is 48.3% female with 51,459 female residents.
Boulder is 51.7% male with 54,973 male residents.
| Gender | Boulder | CO | USA |
|---|---|---|---|
| Female | 48.3% | 49.3% | 50.5% |
| Male | 51.7% | 50.7% | 49.5% |
Highest level of educational attainment in Boulder for adults over 25
See the full breakdown
2.0% of adults in Boulder completed < 9th grade.
1.0% of adults in Boulder completed 9-12th grade.
7.0% of adults in Boulder completed high school / ged.
10.0% of adults in Boulder completed some college.
4.0% of adults in Boulder completed associate's degree.
36.0% of adults in Boulder completed bachelor's degree.
26.0% of adults in Boulder completed master's degree.
5.0% of adults in Boulder completed professional degree.
9.0% of adults in Boulder completed doctorate degree.
| Education | Boulder | CO | USA |
|---|---|---|---|
| < 9th Grade | 2.0% | 3.0% | 4.0% |
| 9-12th Grade | 1.0% | 4.0% | 6.0% |
| High School / GED | 7.0% | 20.0% | 26.0% |
| Some College | 10.0% | 19.0% | 19.0% |
| Associate's Degree | 4.0% | 8.0% | 9.0% |
| Bachelor's Degree | 36.0% | 28.0% | 22.0% |
| Master's Degree | 26.0% | 13.0% | 10.0% |
| Professional Degree | 5.0% | 3.0% | 2.0% |
| Doctorate Degree | 9.0% | 2.0% | 2.0% |
Household Income For Boulder, Colorado
See the full breakdown
8.5% of households in Boulder earn Less than $10,000.
3.7% of households in Boulder earn $10,000 to $14,999.
6.3% of households in Boulder earn $15,000 to $24,999.
7.4% of households in Boulder earn $25,000 to $34,999.
7.0% of households in Boulder earn $35,000 to $49,999.
11.9% of households in Boulder earn $50,000 to $74,999.
8.7% of households in Boulder earn $75,000 to $99,999.
14.1% of households in Boulder earn $100,000 to $149,999.
9.1% of households in Boulder earn $150,000 to $199,999.
23.3% of households in Boulder earn $200,000 or more.
| Income | Boulder | CO | USA |
|---|---|---|---|
| Less than $10,000 | 8.5% | 3.9% | 5.0% |
| $10,000 to $14,999 | 3.7% | 2.4% | 3.4% |
| $15,000 to $24,999 | 6.3% | 4.8% | 6.3% |
| $25,000 to $34,999 | 7.4% | 5.2% | 6.6% |
| $35,000 to $49,999 | 7.0% | 8.4% | 10.1% |
| $50,000 to $74,999 | 11.9% | 14.6% | 15.5% |
| $75,000 to $99,999 | 8.7% | 12.8% | 12.6% |
| $100,000 to $149,999 | 14.1% | 19.2% | 17.5% |
| $150,000 to $199,999 | 9.1% | 11.7% | 9.6% |
| $200,000 or more | 23.3% | 17.0% | 13.4% |
Source: U.S. Census ACS 5-year estimates (2024)


