
Compare Philadelphia to…
Philadelphia SnackAbility
Overall SnackAbility
Cost of living in Philadelphia summary. We use data on the cost of living to determine how expensive it is to live in Philadelphia. Real estate prices drive most of the variance in cost of living around Pennsylvania. Key points include:
The cost of living in Philadelphia is 103 with 100 being average.
The cost of living in Philadelphia is 1.0x higher than the national average.
The median home value in Philadelphia is $231,814.
The median income in Philadelphia is $61,953.
Philadelphia's Overall Cost Of Living
Higher Than The National Average
Cost Of Living In Philadelphia Comparison Table
| Living Expense | Philadelphia | Pennsylvania | National Average |
|---|---|---|---|
| Overall | 103 | 97 | 100 |
| Services | 103 | 99 | 100 |
| Groceries | 100 | 100 | 100 |
| Health | 101 | 88 | 100 |
| Housing | 107 | 102 | 100 |
| Transportation | 99 | 100 | 100 |
| Utilities | 112 | 101 | 100 |
Source: Cost of living index, normalized to US average = 100
Philadelphia, PA Weather
The average high in Philadelphia is 64.5° and the average low is 46.9°.
There are 78.5 days of precipitation each year.
Expect an average of 46.6 inches of precipitation each year with 15.1 inches of snow.
| Stat | Philadelphia |
|---|---|
| Average Annual High | 64.5 |
| Average Annual Low | 46.9 |
| Annual Precipitation Days | 78.5 |
| Average Annual Precipitation | 46.6 |
| Average Annual Snowfall | 15.1 |
Average High
Days of Rain
Source: NOAA climate normals (30-year)
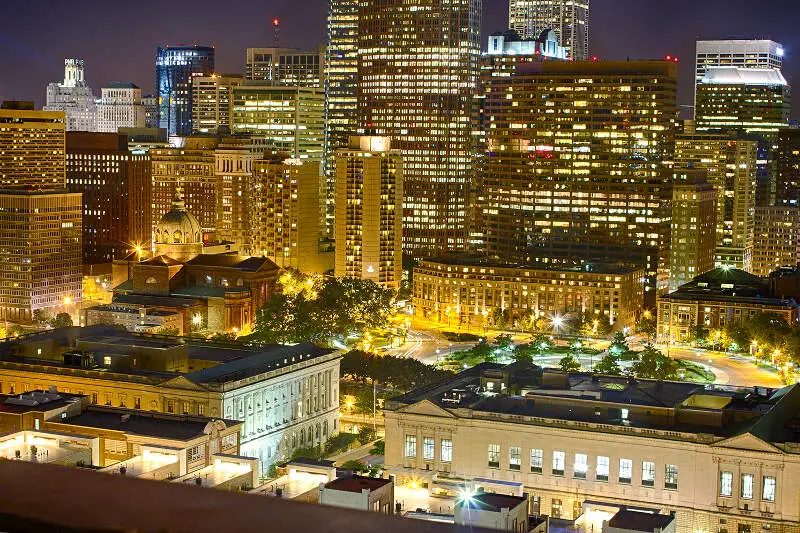
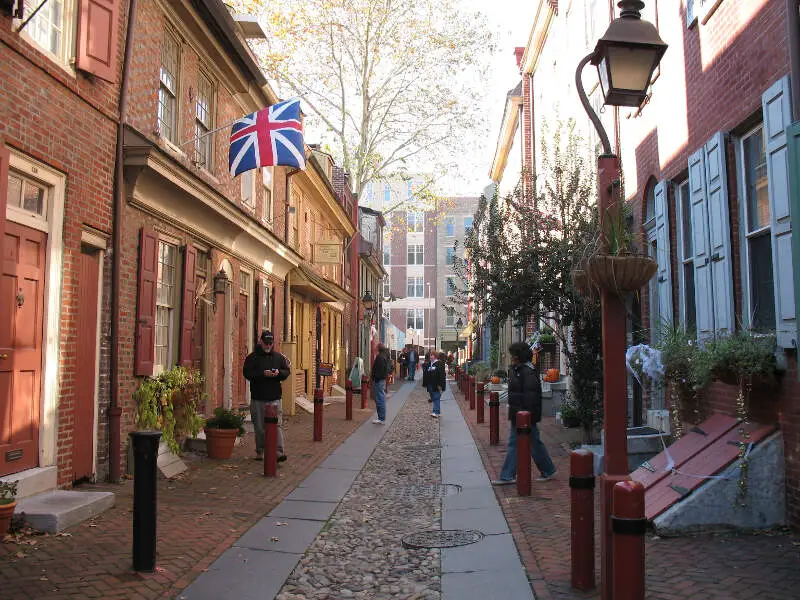
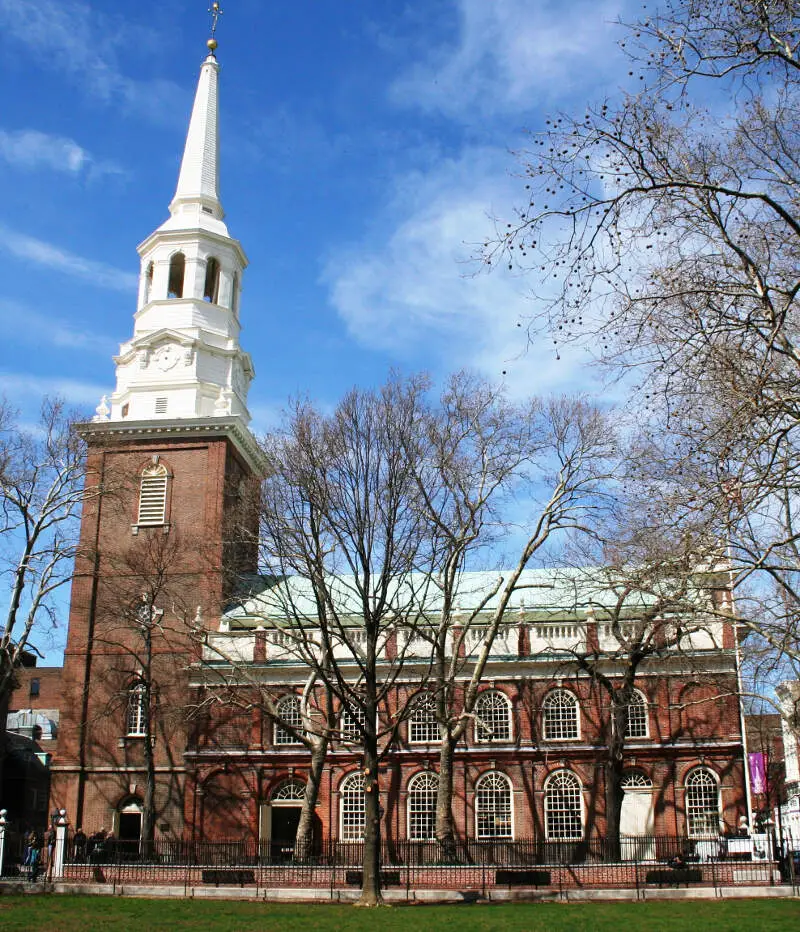
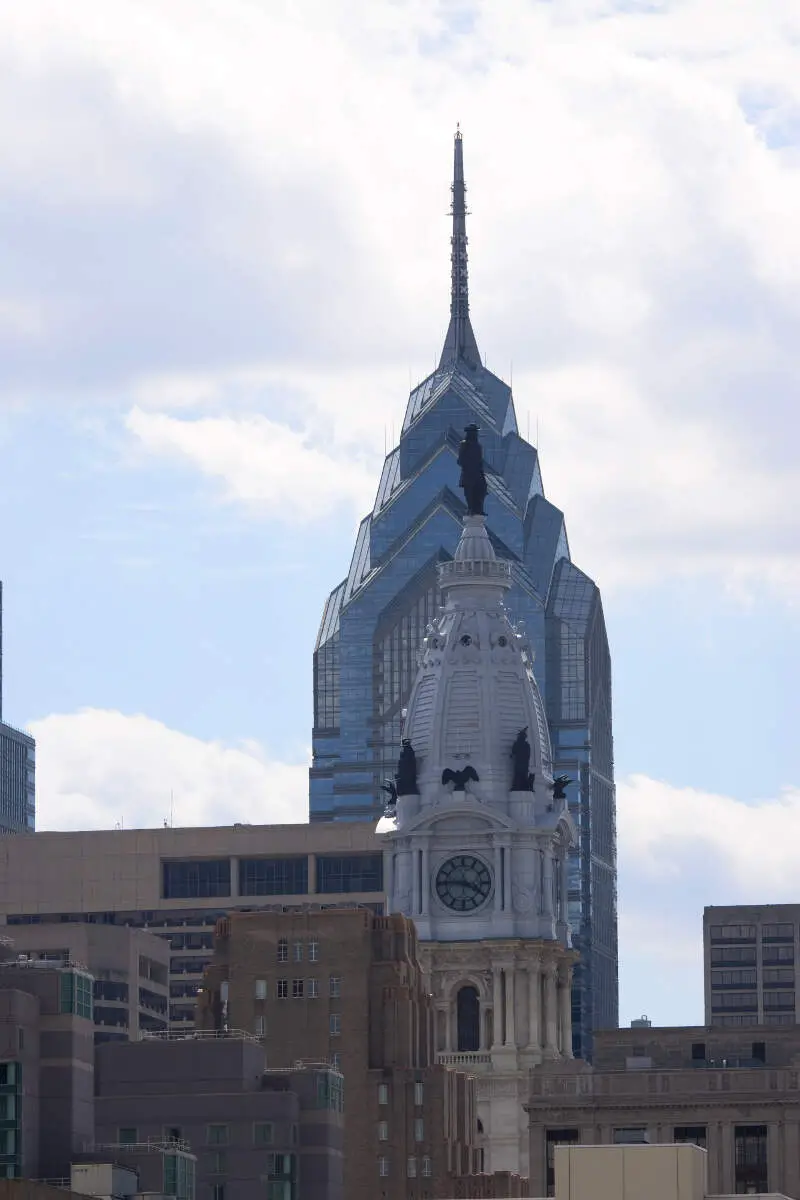
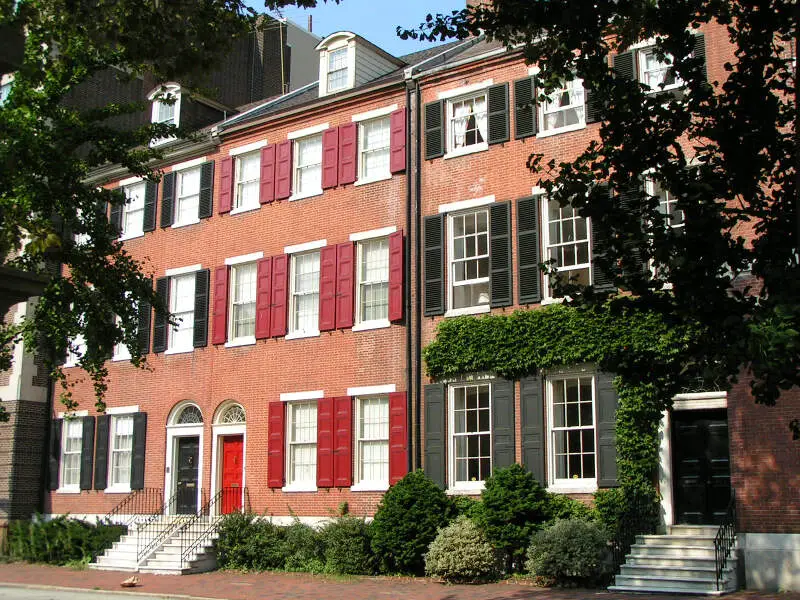
Philadelphia, PA Photos
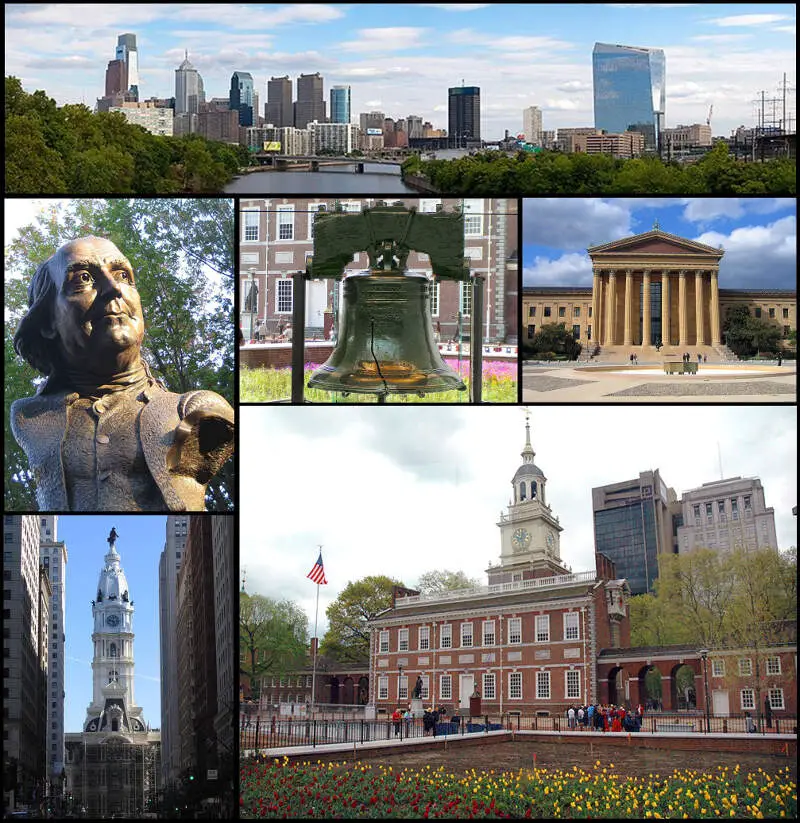
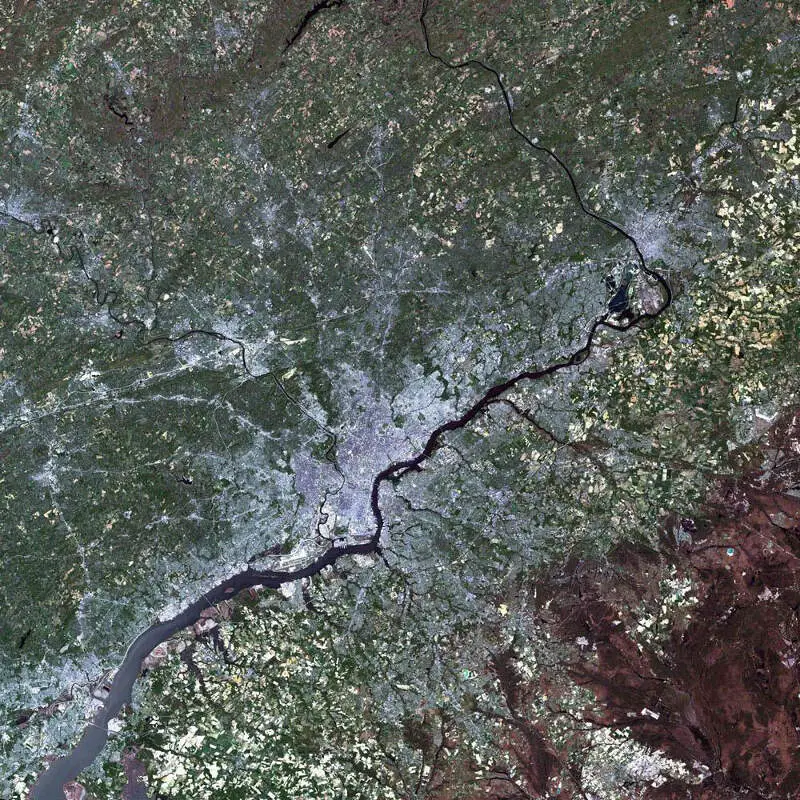
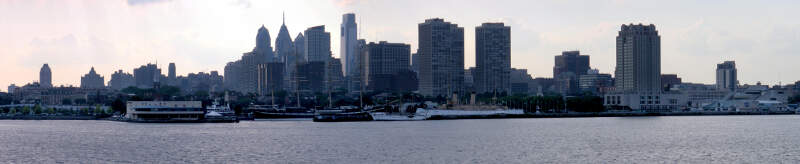
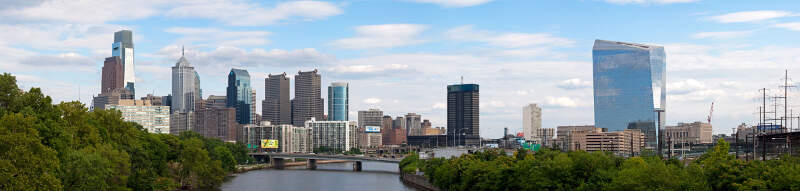
9 Reviews & Comments About Philadelphia

I'm shocked my hometown of Philadelphia was not on a list of worst cities. It's a really s****y place to live not gonna lie
Well I live in Philadelphia,pa and it's pretty s****y here too
The crime is not great, but the overall experience in terms of enjoyment, are good.
I like to go out to places where there is walking.
I loved living in Philadelphia for four years. I lived in West Philadelphia while I attended university in the city. I walked, took taxis, and took public transportation to wherever I wanted to go.
South Street is extremely fun, with a happening music scene and the beautiful Magic Garden. 30th Street Station is convenient and is a nice study in architecture. Additionally, there is an excellent fusion food scene, as well as a great brunch scene.
This is a very diverse city with many people living downtown. Unfortunately, the crime is high and the schools are poor but overall the people are friendly and try to look out for each other.
There are a lot of friendly people and activities here.
Major city of crime, very morning news on the latest shooting, its not a very safe place at all.
Great food, pats is the best place for a cheese-steak
I love Philadelphia because there is so much to do there, so much history, so many firsts, and all kinds of great food.
Eating cheesesteaks, pizza, and drinking Yuengling beer.
Philadelphia is very beautiful with historic features. the crime in philadelphia has went down 60% which is way better than last year. the living in philadelphia is awesome, the houses in certain neighborhoods are beautiful especially in center city philadelphia. the best place to go in philadelphia is pennslanding. Pennslanding has big ships and also there is entertainment on most of them. center city philadelphia is a great place to go as well, there is a lot of night life, clubs, lounges, bars, and restaurants with delicious food.
Center city philadelphia stood out the most because there is a lot of things to do there, like partying.
Philadelphia is always a fun family-friendly spot. The atmosphere is welcoming and has a lot to offer. In terms of location, you have numerous places to visit, from the historical Liberty Bell to the countless museums. As a New Jersey resident, I am thankful to have Philadelphia close to me. I can visit on the weekends and indulge in the delicious Philadelphia Cheesteaks. The food options in Philadelphia are really endless - from China Town to Philly's Little Italy, you have it all in the heart of Pennsylvania. The city of "brotherly love" and the home of the 2017 Super Bowl Champions - The Philadelphia Eagles. A visit to Penn's Landing is also a must with the beautiful view of the Delaware River.
Philadelphia's Penn's Landing also has live-music and delicious food vendors. There is almost a new festival every week celebrating the different cultures of America. There is also free museums, and a whole week of fun events close to the Fourth of July. There is no place better to celebrate America's birthday, than in Philly.
Rankings & Articles For Philadelphia



Locations Around Philadelphia
Map Of Philadelphia, PA
Best Places Around Philadelphia
Ashland, NJ
Population 9,320
Springdale, NJ
Population 15,173
Ramblewood, NJ
Population 6,611
Greentree, NJ
Population 11,537
Penn Wynne, PA
Population 6,070
Oreland, PA
Population 5,953
Glenside, PA
Population 7,659
Wyndmoor, PA
Population 5,633
Montgomeryville, PA
Population 13,388
Maple Glen, PA
Population 6,643
Philadelphia Demographics And Statistics
Population over time in Philadelphia
The current population in Philadelphia is 1,579,706. The population has increased 5.0% from 2010.
| Year | Population | % Change |
|---|---|---|
| 2024 | 1,579,706 | -0.2% |
| 2023 | 1,582,432 | -0.7% |
| 2022 | 1,593,208 | -0.2% |
| 2021 | 1,596,865 | 1.0% |
| 2020 | 1,581,531 | 0.2% |
| 2019 | 1,579,075 | 0.2% |
| 2018 | 1,575,522 | 0.4% |
| 2017 | 1,569,657 | 0.6% |
| 2016 | 1,559,938 | 0.3% |
| 2015 | 1,555,072 | 0.5% |
| 2014 | 1,546,920 | 0.7% |
| 2013 | 1,536,704 | 0.7% |
| 2012 | 1,525,811 | 0.7% |
| 2011 | 1,514,456 | 0.6% |
| 2010 | 1,504,950 | - |
Race / Ethnicity in Philadelphia
See the full breakdown
Philadelphia is:
33.2% White with 524,385 White residents.
38.3% African American with 605,533 African American residents.
0.1% American Indian with 1,837 American Indian residents.
7.9% Asian with 124,921 Asian residents.
0.0% Hawaiian with 212 Hawaiian residents.
0.8% Other with 12,678 Other residents.
4.1% Two Or More with 64,258 Two Or More residents.
15.6% Hispanic with 245,882 Hispanic residents.
| Race | Philadelphia | PA | USA |
|---|---|---|---|
| White | 33.2% | 73.0% | 57.4% |
| African American | 38.3% | 10.3% | 11.9% |
| American Indian | 0.1% | 0.1% | 0.5% |
| Asian | 7.9% | 3.8% | 5.9% |
| Hawaiian | 0.0% | 0.0% | 0.2% |
| Other | 0.8% | 0.5% | 0.6% |
| Two Or More | 4.1% | 3.6% | 4.3% |
| Hispanic | 15.6% | 8.7% | 19.3% |
Gender in Philadelphia
See the full breakdown
Philadelphia is 52.7% female with 832,320 female residents.
Philadelphia is 47.3% male with 747,386 male residents.
| Gender | Philadelphia | PA | USA |
|---|---|---|---|
| Female | 52.7% | 50.7% | 50.5% |
| Male | 47.3% | 49.3% | 49.5% |
Highest level of educational attainment in Philadelphia for adults over 25
See the full breakdown
4.0% of adults in Philadelphia completed < 9th grade.
7.0% of adults in Philadelphia completed 9-12th grade.
30.0% of adults in Philadelphia completed high school / ged.
16.0% of adults in Philadelphia completed some college.
7.0% of adults in Philadelphia completed associate's degree.
20.0% of adults in Philadelphia completed bachelor's degree.
11.0% of adults in Philadelphia completed master's degree.
3.0% of adults in Philadelphia completed professional degree.
2.0% of adults in Philadelphia completed doctorate degree.
| Education | Philadelphia | PA | USA |
|---|---|---|---|
| < 9th Grade | 4.0% | 3.0% | 4.0% |
| 9-12th Grade | 7.0% | 5.0% | 6.0% |
| High School / GED | 30.0% | 33.0% | 26.0% |
| Some College | 16.0% | 15.0% | 19.0% |
| Associate's Degree | 7.0% | 9.0% | 9.0% |
| Bachelor's Degree | 20.0% | 21.0% | 22.0% |
| Master's Degree | 11.0% | 10.0% | 10.0% |
| Professional Degree | 3.0% | 2.0% | 2.0% |
| Doctorate Degree | 2.0% | 2.0% | 2.0% |
Household Income For Philadelphia, Pennsylvania
See the full breakdown
8.5% of households in Philadelphia earn Less than $10,000.
6.0% of households in Philadelphia earn $10,000 to $14,999.
8.7% of households in Philadelphia earn $15,000 to $24,999.
8.4% of households in Philadelphia earn $25,000 to $34,999.
10.6% of households in Philadelphia earn $35,000 to $49,999.
15.7% of households in Philadelphia earn $50,000 to $74,999.
11.4% of households in Philadelphia earn $75,000 to $99,999.
14.6% of households in Philadelphia earn $100,000 to $149,999.
7.1% of households in Philadelphia earn $150,000 to $199,999.
8.9% of households in Philadelphia earn $200,000 or more.
| Income | Philadelphia | PA | USA |
|---|---|---|---|
| Less than $10,000 | 8.5% | 4.9% | 5.0% |
| $10,000 to $14,999 | 6.0% | 3.5% | 3.4% |
| $15,000 to $24,999 | 8.7% | 6.7% | 6.3% |
| $25,000 to $34,999 | 8.4% | 6.9% | 6.6% |
| $35,000 to $49,999 | 10.6% | 10.5% | 10.1% |
| $50,000 to $74,999 | 15.7% | 15.9% | 15.5% |
| $75,000 to $99,999 | 11.4% | 12.8% | 12.6% |
| $100,000 to $149,999 | 14.6% | 17.7% | 17.5% |
| $150,000 to $199,999 | 7.1% | 9.3% | 9.6% |
| $200,000 or more | 8.9% | 11.8% | 13.4% |
Source: U.S. Census ACS 5-year estimates (2024)




