Jersey Cityvs.Philadelphia Which City Is Right for You in 2026?
A head-to-head guide to cost of living, jobs, transportation, weather, crime, and quality of life — so you can decide where to live, work, or visit.
Updated 2026-05-26 · By HomeSnacks Editorial
Jersey City vs. Philadelphia at a glance
Choosing between Jersey City, NJ and Philadelphia, PA comes down to which trade-offs you're willing to make. Jersey City is the second-most populous city in the U.S. state of New Jersey, after Newark. It is the county seat of Hudson County, the county's most populous city and its largest by area. Philadelphia, colloquially referred to as Philly, is the most populous city in the U.S. state of Pennsylvania, and the sixth-most populous city in the United States, with a Census-estimated population of 1,574,281 in July 2025.
On cost of living, Philadelphia is the cheaper city: its overall index sits at 103 versus 146 in Jersey City (100 = national average). Median home values run $658,269 in Jersey City and $231,814 in Philadelphia, with median rents at $2,007 and $1,397 respectively. That puts the home-value-to-income ratio at 6.7x in Jersey City versus 3.7x in Philadelphia.
Public safety is another point of divergence. Jersey City reports 2,591 total crimes per 100,000 residents annually versus 5,457 in Philadelphia. Jersey City is the more racially diverse of the two on a Herfindahl index basis — Jersey City skews 26% Asian while Philadelphia skews 38% Black. On HomeSnacks' overall SnackAbility score, Jersey City edges ahead at 8/10 versus 6/10 for Philadelphia.
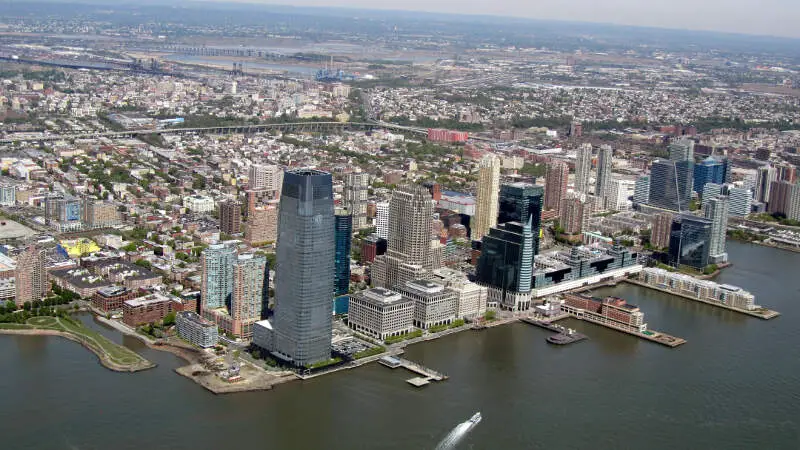
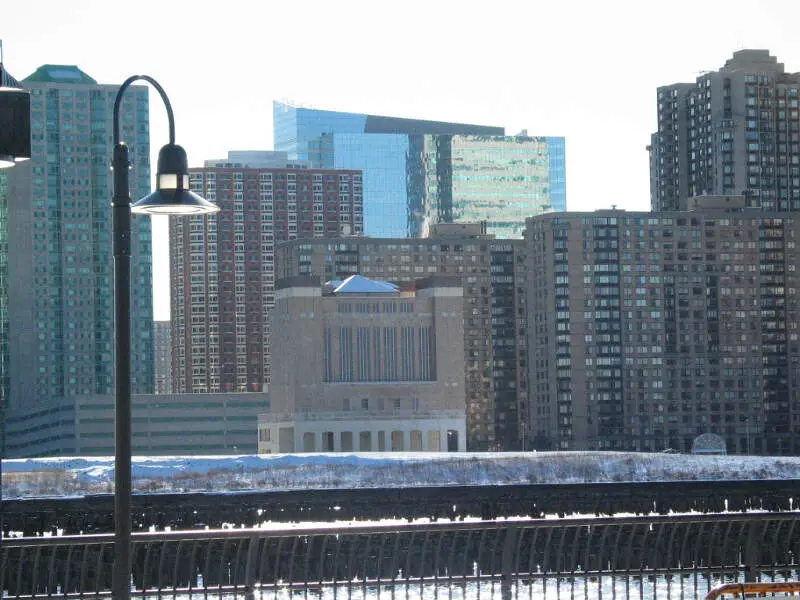
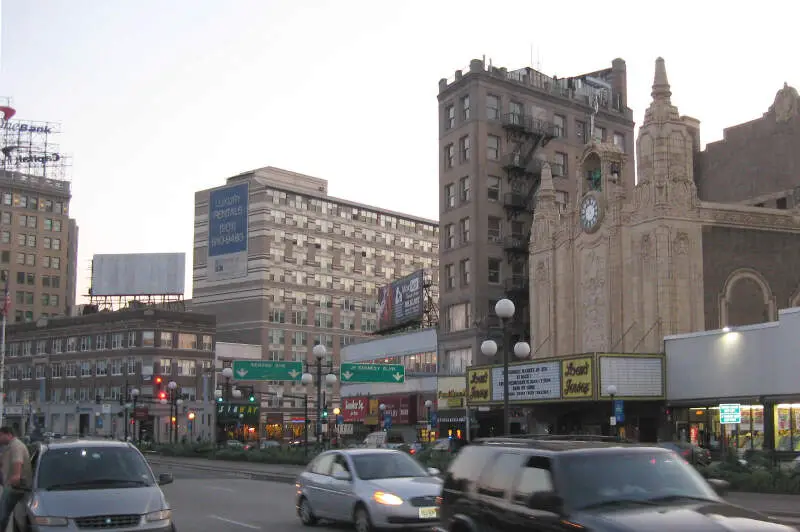
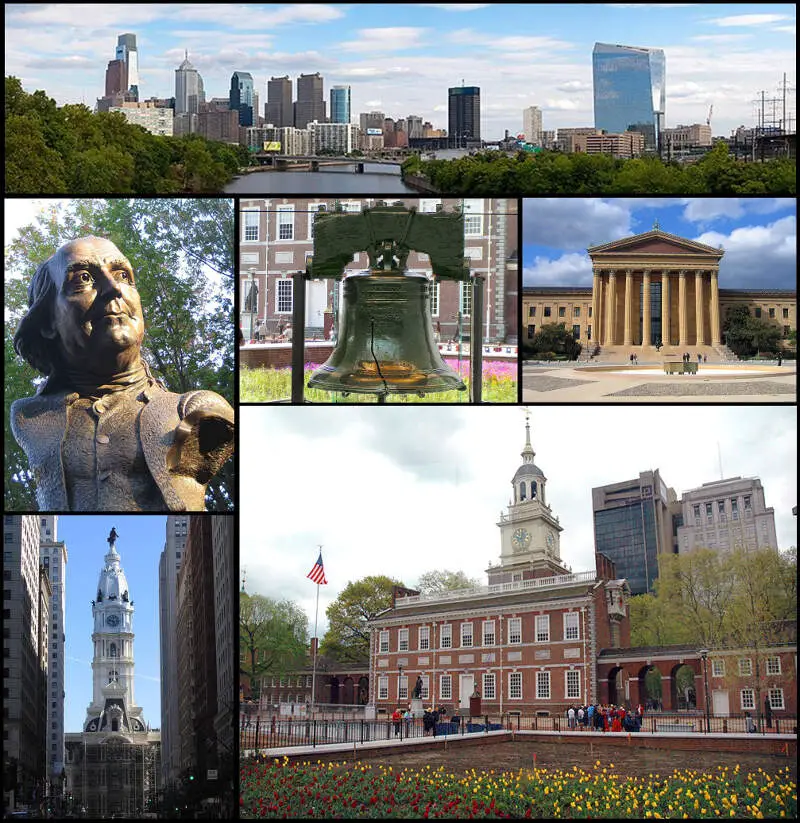
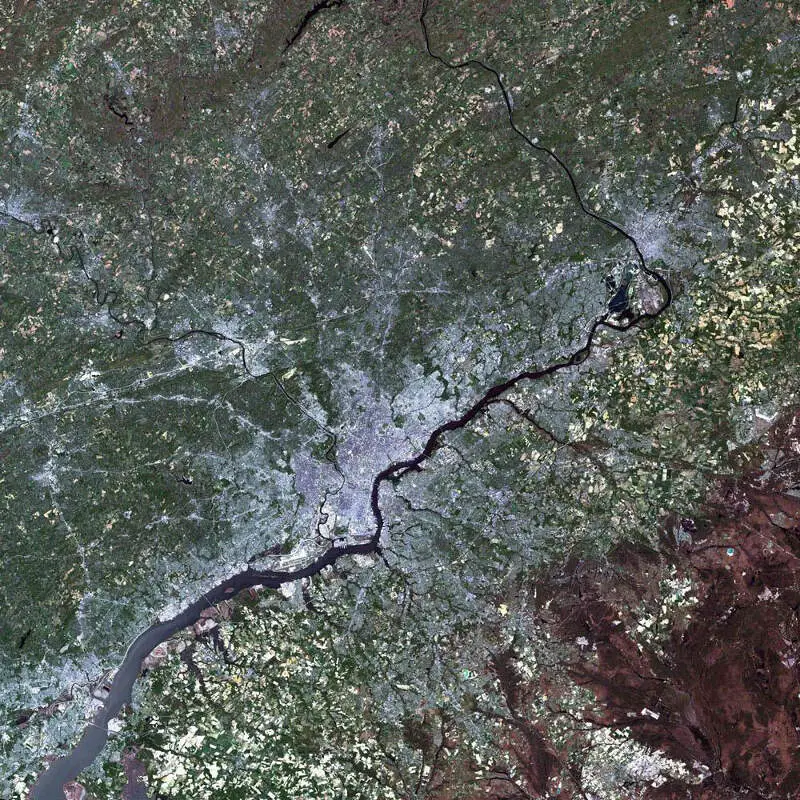
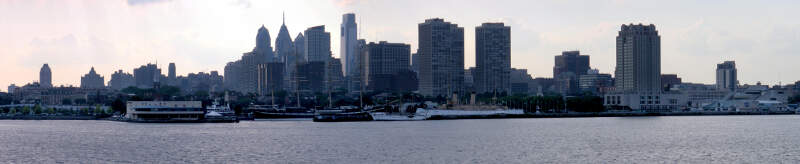
Jersey City vs. Philadelphia in photos
A side-by-side look at each city.
Cost of living
Philadelphia is the cheaper city overall — 42% higher in Jersey City than its rival. Index baseline: 100 = national average.
| Living expense | Jersey City | Philadelphia | US average |
|---|---|---|---|
| Overall | 146 | 103 | 100 |
| Services | 113 | 103 | 100 |
| Groceries | 116 | 100 | 100 |
| Health | 202 | 101 | 100 |
| Housing | 125 | 107 | 100 |
| Transportation | 115 | 99 | 100 |
| Utilities | 125 | 112 | 100 |
Lower index = cheaper. 100 = U.S. national average. Bar inside each cell scales relative to the highest value in the table.
Sources: HomeSnacks Cost of Living indices, normalized so 100 = U.S. national average. Drill in: Jersey City cost of living, Philadelphia cost of living, or the cheapest cities in America.
Housing breakdown
Home prices are higher in Jersey City. Compare absolute price and price-to-income — a $500k home in a $100k-income city is very different from one in a $50k-income city.
| Metric | Jersey City | Philadelphia | United States |
|---|---|---|---|
| Median Home Value | $658,269 | $231,814 | $332,700 |
| Median Rent | $2,007 | $1,397 | $1,413 |
| Median Income | $97,710 | $61,953 | $80,734 |
| Home Value To Income | 6.7x | 3.7x | 4.1x |
| Rent To Monthly Income | 0.25x | 0.27x | 0.21x |
Source: U.S. Census Bureau ACS 2020-2024. See also states with the highest rent in America.
Crime
Jersey City is the safer city — total crime rate of 2,591 per 100k people vs 5,457 for Philadelphia. US average: 2,119.
| Crime (per 100k) | Jersey City | Philadelphia | US average |
|---|---|---|---|
| Total crime | 2,591 | 5,457 | 2,119 |
| Murder | 2 | 17 | 5 |
| Robbery | 173 | 273 | 61 |
| Aggravated Assault | 357 | 572 | 256 |
| Violent Crime | 562 | 909 | 359 |
| Burglary | 206 | 319 | 229 |
| Larceny | 1,526 | 3,224 | 1,272 |
| Car Theft | 297 | 1,006 | 259 |
| Property Crime | 2,029 | 4,548 | 1,760 |
Lower = safer. Bar inside each cell scales relative to the highest crime rate in the table.
Source: FBI Uniform Crime Reporting (2024). All rates are per 100,000 people. City pages: Jersey City crime, Philadelphia crime. See also: safest cities in America.
Diversity
Jersey City is more racially diverse — lower HHI (closer to 0) means a more even mix across groups.
| Group | Jersey City | Philadelphia | United States |
|---|---|---|---|
| White | 23.5% | 33.2% | 57.4% |
| African American | 19.2% | 38.3% | 11.9% |
| American Indian | 0.2% | 0.1% | 0.5% |
| Asian | 26.5% | 7.9% | 5.9% |
| Hawaiian | 0.0% | 0.0% | 0.2% |
| Other | 1.2% | 0.8% | 0.6% |
| Two Or More | 3.7% | 4.1% | 4.3% |
| Hispanic | 25.7% | 15.6% | 19.3% |
Source: U.S. Census ACS 2020-2024. Lower HHI = more even racial mix. See also: most diverse cities in America.
SnackAbility — overall quality of life
Jersey City scores higher overall — 8/10 vs 6/10. SnackAbility is our 1–10 quality-of-life score; the median U.S. city scores a 7.
SnackAbility is a HomeSnacks proprietary 1–10 score blending jobs, housing, education, commute, amenities, affordability, crime, and diversity. Median U.S. city ≈ 7. Data: Census, BLS, FBI. See also: best places to live in America.
Getting around: Jersey City vs. Philadelphia
How each city handles commuting, transit, walkability, and car culture — the day-to-day reality that shapes where you'd actually want to live.
Getting around Jersey City means orienting yourself around New York City. The PATH train connects Downtown Jersey City and Journal Square to Lower and Midtown Manhattan in under 20 minutes, which makes it a real commuter base for NYC workers. NJ Transit buses and the Hudson-Bergen Light Rail cover local gaps, and NY Waterway ferries offer a scenic, pricier option to Midtown.
If you drive, the Holland and Lincoln Tunnels are close but notoriously congested during rush hour.
Philadelphia has SEPTA, a self-contained transit system: the Market-Frankford Line, the Broad Street Line, and a network of trolleys and buses cover most neighborhoods residents actually live in. You can get by without a car in Center City, Fishtown, or West Philly in a way that feels genuinely practical rather than heroic. Philadelphia is also an Amtrak hub at 30th Street Station, so day trips to New York, DC, or Boston are straightforward.
Jobs and careers in Jersey City vs. Philadelphia
The local job market, dominant industries, and which city to choose based on your career.
Jersey City's median household income of $97,710 reflects its tight integration with the New York financial services economy. Goldman Sachs, JPMorgan Chase, and a cluster of fintech and asset management firms have major operations in the Newport and Exchange Place waterfront districts. Remote workers earning NYC salaries while paying New Jersey taxes find the math particularly attractive.
Philadelphia's median household income of $61,953 sits closer to the national norm, but its job market is broad and anchored by large local institutions. Penn Medicine, Jefferson Health, Children's Hospital of Philadelphia, and Thomas Jefferson University make healthcare and life sciences the dominant employer base. Comcast is headquartered here, and a growing University City corridor around Penn and Drexel has seeded a modest but real tech and biotech scene.
Jersey City's income ceiling is higher, but Philadelphia's economy doesn't depend on proximity to New York to hold up.
Weather and climate
What to expect day-to-day — sun, fog, heat, rain, and the seasonal extremes that shape the lifestyle.
Both cities sit in the Mid-Atlantic, so expect four genuine seasons: hot, humid summers, colorful falls, cold winters, and springs that arrive late and leave fast. Jersey City shares essentially the same climate as New York City: July highs typically hover around 85°F, and January lows can dip into the mid-20s. The urban density moderates the cold somewhat, but nor'easters still shut things down a few times each winter.
Philadelphia runs a degree or two warmer on average and occasionally catches a bit less snow than northern New Jersey. Summers in South Philly or West Philly can feel punishing. The humidity is real, and rowhome stock doesn't always have central air.
Fall is the sweet spot in both cities: mild temperatures, low humidity, and good weather for outdoor dining or day trips to the Pocono foothills and the Jersey Shore.
Culture, nightlife, and entertainment
Food, music, neighborhoods, and the city vibe that gives each place its personality.
Jersey City has developed a genuine cultural identity beyond "the place you live before you can afford Brooklyn." The Grove Street and Van Vorst Park areas have a dense restaurant and bar scene, the Mana Contemporary arts complex is one of the larger contemporary art spaces on the East Coast, and neighborhoods like Bergen-Lafayette have attracted muralists and studio artists priced out of Manhattan. That said, you're always a PATH ride from major museums, Broadway, and just about every cuisine on earth, which is either a feature or a crutch depending on your perspective.
Philadelphia doesn't need to borrow anyone's culture. The museum corridor along the Benjamin Franklin Parkway (the Philadelphia Museum of Art, the Barnes Foundation, the Franklin Institute) has some of the strongest collections in the country. Fishtown and Northern Liberties anchor the nightlife scene with dive bars, live music venues, and BYOB restaurants.
The food culture runs deep, from Reading Terminal Market to a cheesesteak debate that people take more seriously than most policy questions. Sports fanaticism here is less a hobby and more a civic religion.
Outdoor activities and day trips
Parks, beaches, hikes, and the weekend escapes that define life outside the city limits.
Liberty State Park is Jersey City's main outdoor space: a broad waterfront green with unobstructed views of the Manhattan skyline and the Statue of Liberty that honestly never gets old. The Hudson River Waterfront Walkway extends pedestrian and cycling access for miles, and the Morris Canal Basin area has been steadily improving. For bigger escapes, the New Jersey Highlands and the Delaware Water Gap are about an hour by car, and the Jersey Shore beaches are a summer standard.
Philadelphia's outdoor options are considerably larger in scale. Fairmount Park is one of the biggest urban park systems in the country, and the Schuylkill River Trail and Kelly Drive give cyclists and runners a continuous riverside route from Center City to Manayunk. The Wissahickon Valley (hemlock gorges, dirt carriage roads, horse trails) sits inside city limits and feels nothing like a city.
Day trips to Valley Forge, the Pocono Mountains, or the Delaware Beaches are all under two hours. If access to nature matters to your lifestyle, Philadelphia has a meaningful edge.
Bottom line: which city is right for you?
Based on the head-to-head data above, here's the short version — pick the city that lines up with what you actually care about.
Choose Jersey City if you prioritize…
- lower crime — a safer place to live, work, and raise a family.
- more affordable housing relative to Philadelphia.
- a more racially diverse community (lower HHI on Census data).
- a higher overall SnackAbility quality-of-life score.
Choose Philadelphia if you prioritize…
- a lower cost of living (cheaper groceries, services, and day-to-day expenses).
Methodology: winners are picked from public data — U.S. Census Bureau ACS (income, home value, rent, race/HHI), FBI Uniform Crime Reporting (crime rates per 100k), and HomeSnacks' proprietary SnackAbility quality-of-life score, which blends Bureau of Labor Statistics data with the above.
More about New Jersey & Pennsylvania

Best Places To Live In New Jersey
Photo: Public domain
Cheapest Places To Live In New Jersey
Photo: Public domain
Most Dangerous Cities In New Jersey
Photo: Public domain
Best Places To Raise A Family In New Jersey
Photo: Public domain
Best Places To Retire In New Jersey
Photo: Public domain
Richest Cities In New Jersey
Photo: Public domain
Safest Places In New Jersey
Photo: Public domain
Worst Places To Live In New Jersey
Photo: Public domain