Newarkvs.Philadelphia Which City Is Right for You in 2026?
A head-to-head guide to cost of living, jobs, transportation, weather, crime, and quality of life — so you can decide where to live, work, or visit.
Updated 2026-05-26 · By HomeSnacks Editorial
Newark vs. Philadelphia at a glance
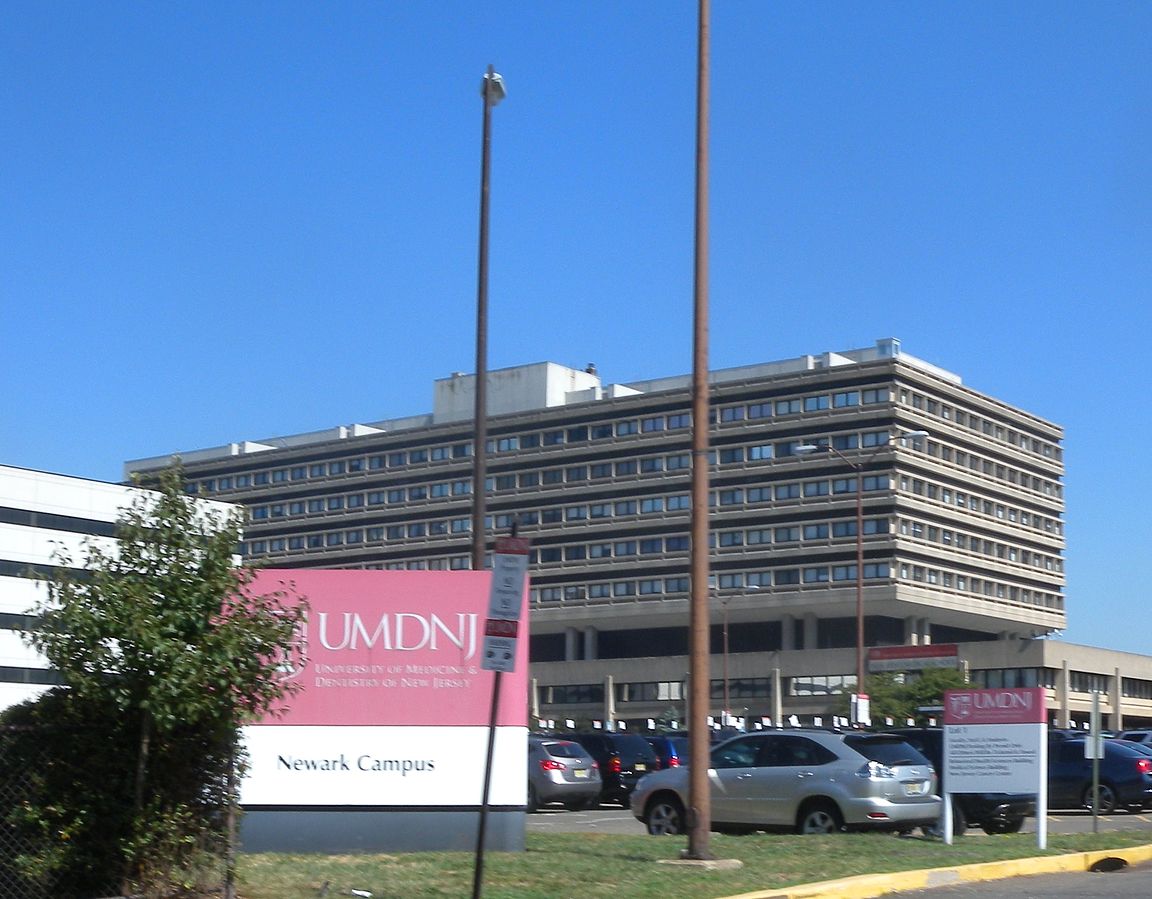
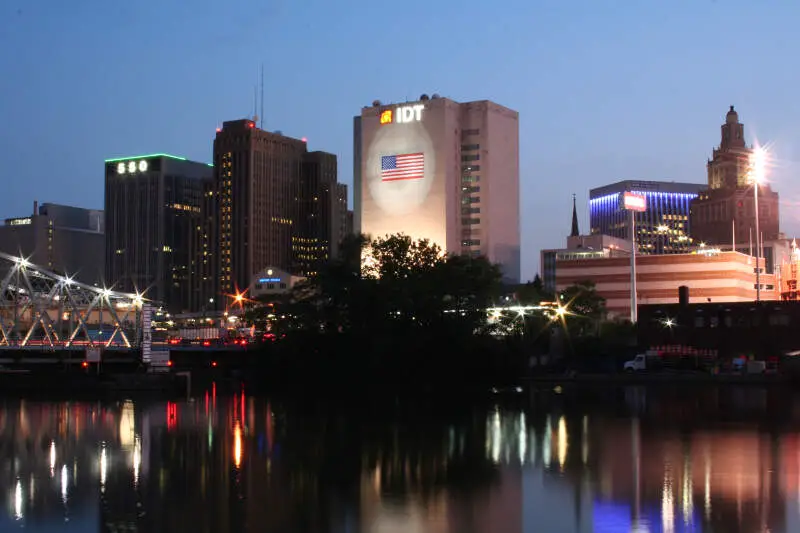
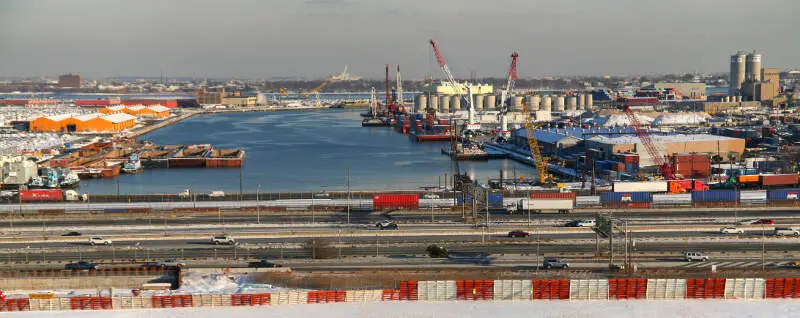
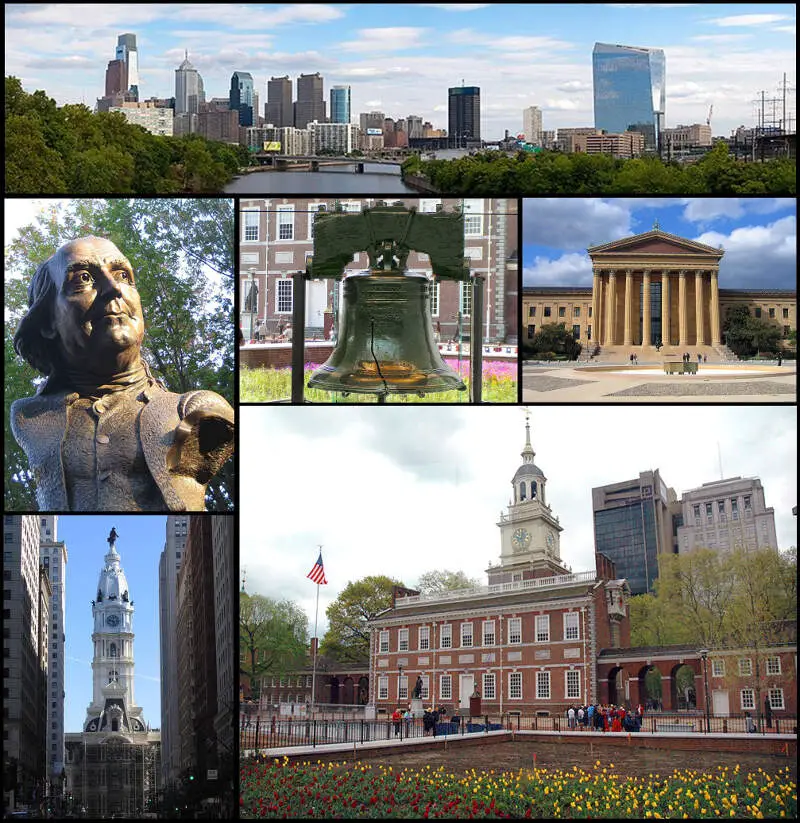
Choosing between Newark, NJ and Philadelphia, PA comes down to which trade-offs you're willing to make. Newark is the most populous city in the U.S. state of New Jersey, the county seat of Essex County, and a principal city of the New York metropolitan area. As of the 2020 census, the city's population was 311,549. Philadelphia, colloquially referred to as Philly, is the most populous city in the U.S. state of Pennsylvania, and the sixth-most populous city in the United States, with a Census-estimated population of 1,574,281 in July 2025.
On cost of living, Philadelphia is the cheaper city: its overall index sits at 103 versus 121 in Newark (100 = national average). Median home values run $478,454 in Newark and $231,814 in Philadelphia, with median rents at $1,392 and $1,397 respectively. That puts the home-value-to-income ratio at 9.2x in Newark versus 3.7x in Philadelphia.
On crime, the picture shifts. Newark reports 2,539 total crimes per 100,000 residents annually versus 5,457 in Philadelphia. Philadelphia is the more racially diverse of the two on a Herfindahl index basis — Newark skews 45% Black while Philadelphia skews 38% Black. On HomeSnacks' overall SnackAbility score, Philadelphia edges ahead at 6/10 versus 4/10 for Newark.
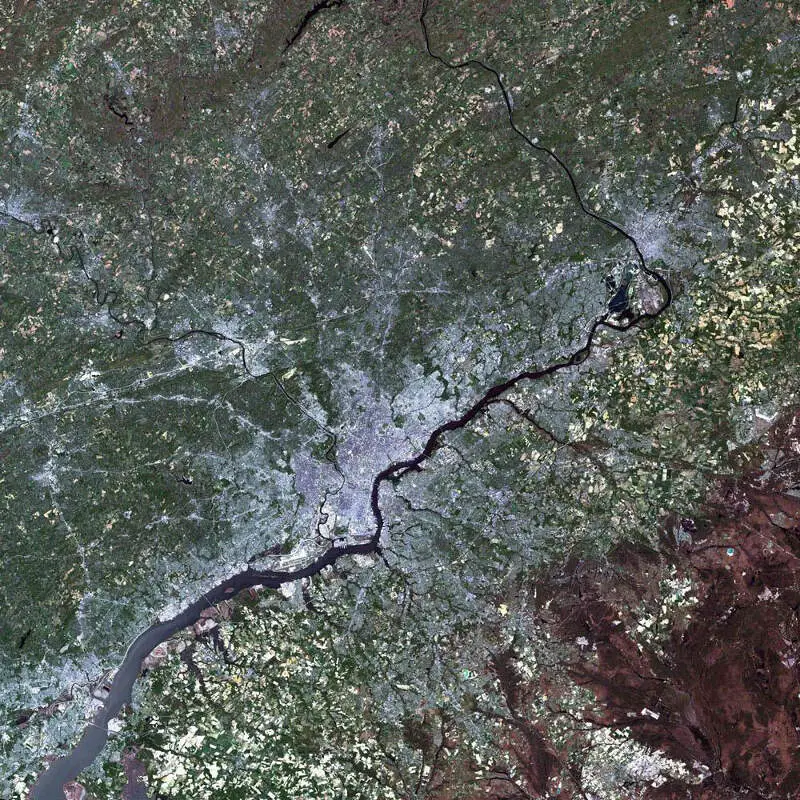
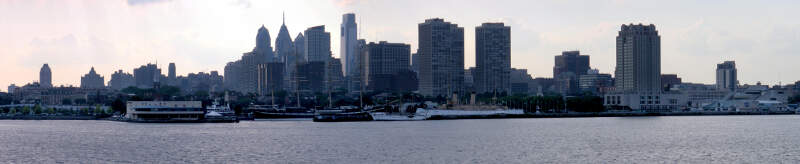
Newark vs. Philadelphia in photos
A side-by-side look at each city.
Cost of living
Philadelphia is the cheaper city overall — 17% higher in Newark than its rival. Index baseline: 100 = national average.
| Living expense | Newark | Philadelphia | US average |
|---|---|---|---|
| Overall | 121 | 103 | 100 |
| Services | 106 | 103 | 100 |
| Groceries | 110 | 100 | 100 |
| Health | 135 | 101 | 100 |
| Housing | 119 | 107 | 100 |
| Transportation | 110 | 99 | 100 |
| Utilities | 117 | 112 | 100 |
Lower index = cheaper. 100 = U.S. national average. Bar inside each cell scales relative to the highest value in the table.
Sources: HomeSnacks Cost of Living indices, normalized so 100 = U.S. national average. Drill in: Newark cost of living, Philadelphia cost of living, or the cheapest cities in America.
Housing breakdown
Home prices are higher in Newark. Compare absolute price and price-to-income — a $500k home in a $100k-income city is very different from one in a $50k-income city.
| Metric | Newark | Philadelphia | United States |
|---|---|---|---|
| Median Home Value | $478,454 | $231,814 | $332,700 |
| Median Rent | $1,392 | $1,397 | $1,413 |
| Median Income | $52,060 | $61,953 | $80,734 |
| Home Value To Income | 9.2x | 3.7x | 4.1x |
| Rent To Monthly Income | 0.32x | 0.27x | 0.21x |
Source: U.S. Census Bureau ACS 2020-2024. See also states with the highest rent in America.
Crime
Newark is the safer city — total crime rate of 2,539 per 100k people vs 5,457 for Philadelphia. US average: 2,119.
| Crime (per 100k) | Newark | Philadelphia | US average |
|---|---|---|---|
| Total crime | 2,539 | 5,457 | 2,119 |
| Murder | 13 | 17 | 5 |
| Robbery | 143 | 273 | 61 |
| Aggravated Assault | 385 | 572 | 256 |
| Violent Crime | 581 | 909 | 359 |
| Burglary | 152 | 319 | 229 |
| Larceny | 931 | 3,224 | 1,272 |
| Car Theft | 874 | 1,006 | 259 |
| Property Crime | 1,957 | 4,548 | 1,760 |
Lower = safer. Bar inside each cell scales relative to the highest crime rate in the table.
Source: FBI Uniform Crime Reporting (2024). All rates are per 100,000 people. City pages: Newark crime, Philadelphia crime. See also: safest cities in America.
Diversity
Philadelphia is more racially diverse — lower HHI (closer to 0) means a more even mix across groups.
| Group | Newark | Philadelphia | United States |
|---|---|---|---|
| White | 8.9% | 33.2% | 57.4% |
| African American | 44.8% | 38.3% | 11.9% |
| American Indian | 0.1% | 0.1% | 0.5% |
| Asian | 2.0% | 7.9% | 5.9% |
| Hawaiian | 0.0% | 0.0% | 0.2% |
| Other | 2.5% | 0.8% | 0.6% |
| Two Or More | 4.1% | 4.1% | 4.3% |
| Hispanic | 37.6% | 15.6% | 19.3% |
Source: U.S. Census ACS 2020-2024. Lower HHI = more even racial mix. See also: most diverse cities in America.
SnackAbility — overall quality of life
Philadelphia scores higher overall — 6/10 vs 4/10. SnackAbility is our 1–10 quality-of-life score; the median U.S. city scores a 7.
SnackAbility is a HomeSnacks proprietary 1–10 score blending jobs, housing, education, commute, amenities, affordability, crime, and diversity. Median U.S. city ≈ 7. Data: Census, BLS, FBI. See also: best places to live in America.
Getting around: Newark vs. Philadelphia
How each city handles commuting, transit, walkability, and car culture — the day-to-day reality that shapes where you'd actually want to live.
PATH trains from Newark Penn Station reach Manhattan's World Trade Center and 33rd Street in about 20 minutes. NJ Transit's commuter rail covers the broader region, and the Newark Light Rail handles trips within the city.
If you commute by car, expect real congestion on I-78 and the NJ Turnpike. Short distances regularly mean long delays.
Philadelphia's SEPTA is a more self-contained system. The Market-Frankford Line, Broad Street Line, regional rail, trolleys, and buses let you get around Center City and most neighborhoods without a car. Amtrak's 30th Street Station puts Philly on the broader Northeast Corridor.
For in-city mobility, SEPTA has the edge. For rapid access to New York, Newark's PATH wins.
Jobs and careers in Newark vs. Philadelphia
The local job market, dominant industries, and which city to choose based on your career.
Newark's economy functions partly as a satellite of New York City. Major local employers include Prudential Financial (headquartered downtown), Panasonic North America, Rutgers University-Newark, and Newark Liberty International Airport. Many residents commute to Manhattan rather than working locally.
The median household income sits at $52,060, below the broader metro average. With a cost of living index of 121 against the US baseline of 100, your money goes less far here than in most of the country.
Philadelphia's job market is more self-sustaining. Penn Medicine, Jefferson Health, and Children's Hospital of Philadelphia anchor the healthcare sector, while Penn, Drexel, and Temple drive a large education economy. With a median household income of $61,953 and a cost of living index of just 103, your paycheck goes further in Philly than in Newark.
Weather and climate
What to expect day-to-day — sun, fog, heat, rain, and the seasonal extremes that shape the lifestyle.
Newark and Philadelphia share nearly identical Mid-Atlantic climates, separated by about 90 miles. Summers are hot and humid, with July highs in the upper 80s and heat-index readings that make air conditioning non-negotiable. Winters bring cold snaps and occasional snow, with January lows near the mid-20s in both cities.
Philadelphia's slightly more southern position gives it marginally warmer winters and a bit less snow than Newark. Neither city is a climate draw, and if you're relocating for weather, you're not moving to either one. Spring and fall are genuinely pleasant in both places, with comfortable temperatures and lower humidity for a good stretch of the year.
Culture, nightlife, and entertainment
Food, music, neighborhoods, and the city vibe that gives each place its personality.
Philadelphia has more major cultural institutions than most cities its size. The Philadelphia Museum of Art, the Barnes Foundation, and the Kimmel Center for the Performing Arts sit close together, while neighborhoods like Fishtown, Northern Liberties, and South Street have independent bars, live music venues, and chef-driven restaurants. Reading Terminal Market, a covered food hall open since 1893, is part of daily life for many residents.
Newark has real cultural assets that often go underappreciated. NJPAC draws major national and international acts, and the Ironbound neighborhood along Ferry Street (Newark's Portuguese-Brazilian enclave) has some of the best churrascos and seafood in the Northeast. For breadth of walkable entertainment districts, late-night options, and major institutions, Philadelphia has the clear edge.
Outdoor activities and day trips
Parks, beaches, hikes, and the weekend escapes that define life outside the city limits.
Philadelphia's Fairmount Park system is one of the largest urban park networks in the country, covering the Schuylkill River Trail, the wooded gorge trails of Wissahickon Valley Park, and miles of connected greenway. Weekend day trips reach the Delaware Water Gap in about 90 minutes and the Pocono Mountains in under two hours. The Jersey Shore is roughly the same distance from either city.
Newark's standout outdoor asset is Branch Brook Park, which has the largest cherry blossom collection in the United States and draws real crowds each spring. The Watchung Reservation and South Mountain Reservation in Essex County offer solid hiking within 30 minutes of downtown. Both cities have reasonable outdoor access, but Philadelphia's in-city park system is significantly more extensive, with more green space that never requires leaving city limits.
Bottom line: which city is right for you?
Based on the head-to-head data above, here's the short version — pick the city that lines up with what you actually care about.
Choose Newark if you prioritize…
- lower crime — a safer place to live, work, and raise a family.
- more affordable housing relative to Philadelphia.
Choose Philadelphia if you prioritize…
- a lower cost of living (cheaper groceries, services, and day-to-day expenses).
- a more racially diverse community (lower HHI on Census data).
- a higher overall SnackAbility quality-of-life score.
Methodology: winners are picked from public data — U.S. Census Bureau ACS (income, home value, rent, race/HHI), FBI Uniform Crime Reporting (crime rates per 100k), and HomeSnacks' proprietary SnackAbility quality-of-life score, which blends Bureau of Labor Statistics data with the above.
More about New Jersey & Pennsylvania

Best Places To Live In New Jersey
Photo: Public domain
Cheapest Places To Live In New Jersey
Photo: Public domain
Most Dangerous Cities In New Jersey
Photo: Public domain
Best Places To Raise A Family In New Jersey
Photo: Public domain
Best Places To Retire In New Jersey
Photo: Public domain
Richest Cities In New Jersey
Photo: Public domain
Safest Places In New Jersey
Photo: Public domain
Worst Places To Live In New Jersey
Photo: Public domain