Carpentersville SnackAbility
Overall SnackAbility
Crime in Carpentersville summary. We use data from the FBI to determine the crime rates in Carpentersville. Key points include:
There were 328 total crimes in Carpentersville in the last reporting year.
The overall crime rate per 100,000 people in Carpentersville is 890.5 / 100k people.
The violent crime rate per 100,000 people in Carpentersville is 111.3 / 100k people.
The property crime rate per 100,000 people in Carpentersville is 779.2 / 100k people.
Overall, crime in Carpentersville is -57.98% below the national average.
Total Crimes
Below National Average
Crime In Carpentersville Comparison Table
| Statistic | Count Raw |
Carpentersville / 100k People |
Illinois / 100k People |
National / 100k People |
|---|---|---|---|---|
| Total Crimes Per 100K | 328 | 890.5 | 2,004.4 | 2,119.2 |
| Violent Crime | 41 | 111.3 | 289.2 | 359.0 |
| Murder | 0 | 0.0 | 5.8 | 5.0 |
| Robbery | 3 | 8.1 | 90.2 | 61.0 |
| Aggravated Assault | 24 | 65.2 | 146.3 | 256.0 |
| Property Crime | 287 | 779.2 | 1,715.2 | 1,760.0 |
| Burglary | 76 | 206.3 | 290.5 | 229.0 |
| Larceny | 199 | 540.3 | 1,134.4 | 1,272.0 |
| Car Theft | 12 | 32.6 | 290.4 | 259.0 |
Source: FBI Uniform Crime Reporting (2024)
Cost of living in Carpentersville summary. We use data on the cost of living to determine how expensive it is to live in Carpentersville. Real estate prices drive most of the variance in cost of living around Illinois. Key points include:
The cost of living in Carpentersville is 102 with 100 being average.
The cost of living in Carpentersville is 1.0x higher than the national average.
The median home value in Carpentersville is $285,617.
The median income in Carpentersville is $86,917.
Carpentersville's Overall Cost Of Living
Higher Than The National Average
Cost Of Living In Carpentersville Comparison Table
| Living Expense | Carpentersville | Illinois | National Average |
|---|---|---|---|
| Overall | 102 | 98 | 100 |
| Services | 100 | 99 | 100 |
| Groceries | 101 | 99 | 100 |
| Health | 106 | 96 | 100 |
| Housing | 100 | 101 | 100 |
| Transportation | 98 | 99 | 100 |
| Utilities | 99 | 101 | 100 |
Source: Cost of living index, normalized to US average = 100
Carpentersville, IL Weather
The average high in Carpentersville is 58.6° and the average low is 38.5°.
There are 70.7 days of precipitation each year.
Expect an average of 35.9 inches of precipitation each year with 30.0 inches of snow.
| Stat | Carpentersville |
|---|---|
| Average Annual High | 58.6 |
| Average Annual Low | 38.5 |
| Annual Precipitation Days | 70.7 |
| Average Annual Precipitation | 35.9 |
| Average Annual Snowfall | 30.0 |
Average High
Days of Rain
Source: NOAA climate normals (30-year)
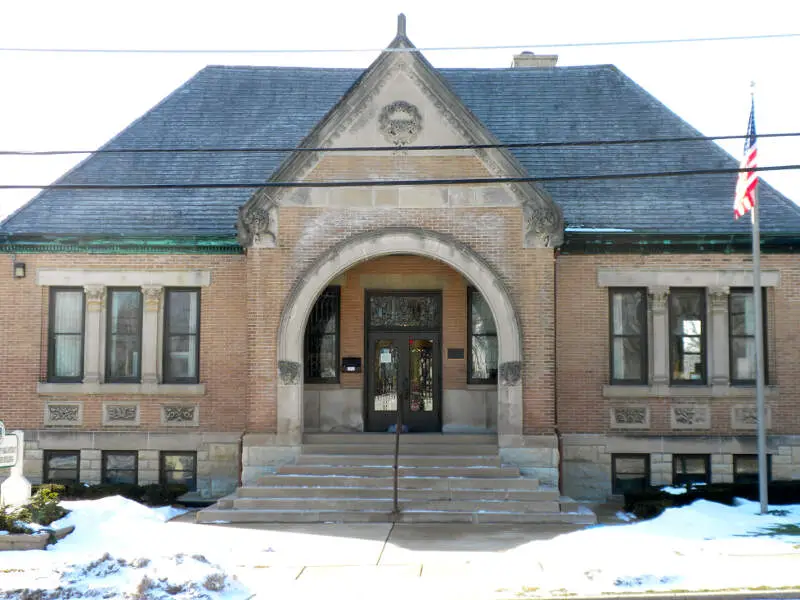
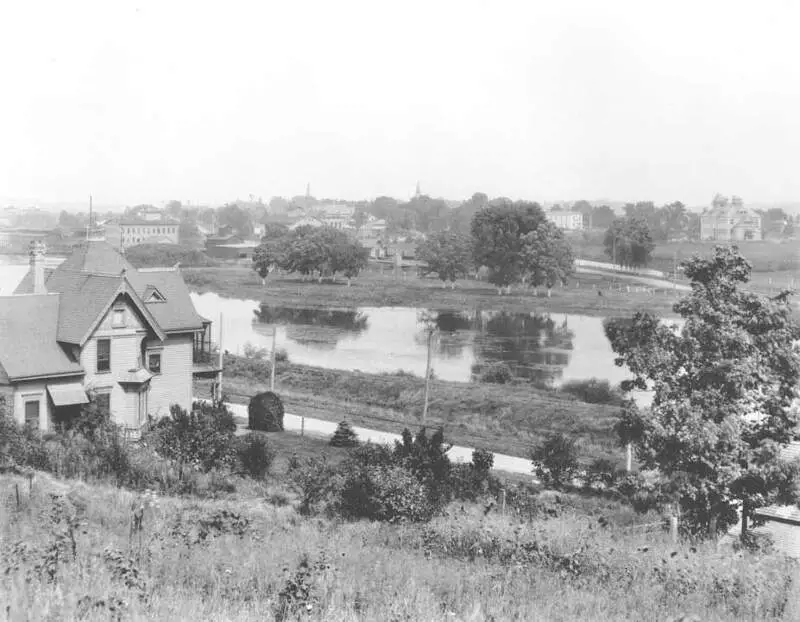
Carpentersville, IL Photos
1 Reviews & Comments About Carpentersville

Carpentersville is a sleepy village about 40 miles from downtown Chicago and makes for a great visit. It has plenty of friendly citizens and the large park in the center of the village is beautiful. Every year they hold a big Civil War reenactment there.
The area is very diverse which means great food is never far! The schools have a lower rating, but that's mostly because of the high amount of english second language learners. The village also has a lower rate of crime than surrounding areas, despite the unearned reputation.
Rankings & Articles For Carpentersville


Locations Around Carpentersville
Map Of Carpentersville, IL
Best Places Around Carpentersville
Buffalo Grove, IL
Population 42,891
Winfield, IL
Population 10,095
Lake Zurich, IL
Population 19,832
Arlington Heights, IL
Population 76,005
Bartlett, IL
Population 40,501
Hawthorn Woods, IL
Population 9,143
Vernon Hills, IL
Population 26,876
Mount Prospect, IL
Population 55,472
Hoffman Estates, IL
Population 51,175
Long Grove, IL
Population 8,305
Carpentersville Demographics And Statistics
Population over time in Carpentersville
The current population in Carpentersville is 37,346. The population has increased 0.7% from 2010.
| Year | Population | % Change |
|---|---|---|
| 2024 | 37,346 | -0.5% |
| 2023 | 37,544 | -0.8% |
| 2022 | 37,834 | -0.3% |
| 2021 | 37,940 | 0.9% |
| 2020 | 37,618 | -0.7% |
| 2019 | 37,872 | -0.7% |
| 2018 | 38,138 | -0.4% |
| 2017 | 38,280 | 0.0% |
| 2016 | 38,275 | 0.0% |
| 2015 | 38,264 | 0.4% |
| 2014 | 38,128 | 0.5% |
| 2013 | 37,953 | 0.5% |
| 2012 | 37,758 | 0.7% |
| 2011 | 37,480 | 1.0% |
| 2010 | 37,094 | - |
Race / Ethnicity in Carpentersville
See the full breakdown
Carpentersville is:
30.0% White with 11,206 White residents.
4.9% African American with 1,832 African American residents.
0.1% American Indian with 21 American Indian residents.
4.1% Asian with 1,522 Asian residents.
0.0% Hawaiian with 0 Hawaiian residents.
0.0% Other with 0 Other residents.
3.6% Two Or More with 1,329 Two Or More residents.
57.4% Hispanic with 21,436 Hispanic residents.
| Race | Carpentersville | IL | USA |
|---|---|---|---|
| White | 30.0% | 58.1% | 57.4% |
| African American | 4.9% | 13.3% | 11.9% |
| American Indian | 0.1% | 0.1% | 0.5% |
| Asian | 4.1% | 5.9% | 5.9% |
| Hawaiian | 0.0% | 0.0% | 0.2% |
| Other | 0.0% | 0.4% | 0.6% |
| Two Or More | 3.6% | 3.4% | 4.3% |
| Hispanic | 57.4% | 18.8% | 19.3% |
Gender in Carpentersville
See the full breakdown
Carpentersville is 49.7% female with 18,550 female residents.
Carpentersville is 50.3% male with 18,796 male residents.
| Gender | Carpentersville | IL | USA |
|---|---|---|---|
| Female | 49.7% | 50.6% | 50.5% |
| Male | 50.3% | 49.4% | 49.5% |
Highest level of educational attainment in Carpentersville for adults over 25
See the full breakdown
12.0% of adults in Carpentersville completed < 9th grade.
10.0% of adults in Carpentersville completed 9-12th grade.
29.0% of adults in Carpentersville completed high school / ged.
18.0% of adults in Carpentersville completed some college.
6.0% of adults in Carpentersville completed associate's degree.
17.0% of adults in Carpentersville completed bachelor's degree.
7.0% of adults in Carpentersville completed master's degree.
1.0% of adults in Carpentersville completed professional degree.
0.0% of adults in Carpentersville completed doctorate degree.
| Education | Carpentersville | IL | USA |
|---|---|---|---|
| < 9th Grade | 12.0% | 5.0% | 4.0% |
| 9-12th Grade | 10.0% | 5.0% | 6.0% |
| High School / GED | 29.0% | 25.0% | 26.0% |
| Some College | 18.0% | 19.0% | 19.0% |
| Associate's Degree | 6.0% | 8.0% | 9.0% |
| Bachelor's Degree | 17.0% | 23.0% | 22.0% |
| Master's Degree | 7.0% | 11.0% | 10.0% |
| Professional Degree | 1.0% | 2.0% | 2.0% |
| Doctorate Degree | 0.0% | 2.0% | 2.0% |
Household Income For Carpentersville, Illinois
See the full breakdown
3.1% of households in Carpentersville earn Less than $10,000.
3.0% of households in Carpentersville earn $10,000 to $14,999.
4.5% of households in Carpentersville earn $15,000 to $24,999.
3.8% of households in Carpentersville earn $25,000 to $34,999.
9.5% of households in Carpentersville earn $35,000 to $49,999.
17.9% of households in Carpentersville earn $50,000 to $74,999.
15.5% of households in Carpentersville earn $75,000 to $99,999.
25.7% of households in Carpentersville earn $100,000 to $149,999.
8.8% of households in Carpentersville earn $150,000 to $199,999.
8.2% of households in Carpentersville earn $200,000 or more.
| Income | Carpentersville | IL | USA |
|---|---|---|---|
| Less than $10,000 | 3.1% | 5.4% | 5.0% |
| $10,000 to $14,999 | 3.0% | 3.2% | 3.4% |
| $15,000 to $24,999 | 4.5% | 5.9% | 6.3% |
| $25,000 to $34,999 | 3.8% | 6.3% | 6.6% |
| $35,000 to $49,999 | 9.5% | 9.7% | 10.1% |
| $50,000 to $74,999 | 17.9% | 14.8% | 15.5% |
| $75,000 to $99,999 | 15.5% | 12.6% | 12.6% |
| $100,000 to $149,999 | 25.7% | 18.0% | 17.5% |
| $150,000 to $199,999 | 8.8% | 10.1% | 9.6% |
| $200,000 or more | 8.2% | 13.8% | 13.4% |
Source: U.S. Census ACS 5-year estimates (2024)


