Champaign SnackAbility
Overall SnackAbility
Crime in Champaign summary. We use data from the FBI to determine the crime rates in Champaign. Key points include:
There were 2,488 total crimes in Champaign in the last reporting year.
The overall crime rate per 100,000 people in Champaign is 2,780.9 / 100k people.
The violent crime rate per 100,000 people in Champaign is 501.9 / 100k people.
The property crime rate per 100,000 people in Champaign is 2,279.1 / 100k people.
Overall, crime in Champaign is 31.22% above the national average.
Total Crimes
Above National Average
Crime In Champaign Comparison Table
| Statistic | Count Raw |
Champaign / 100k People |
Illinois / 100k People |
National / 100k People |
|---|---|---|---|---|
| Total Crimes Per 100K | 2,488 | 2,780.9 | 2,004.4 | 2,119.2 |
| Violent Crime | 449 | 501.9 | 289.2 | 359.0 |
| Murder | 5 | 5.6 | 5.8 | 5.0 |
| Robbery | 82 | 91.7 | 90.2 | 61.0 |
| Aggravated Assault | 301 | 336.4 | 146.3 | 256.0 |
| Property Crime | 2,039 | 2,279.1 | 1,715.2 | 1,760.0 |
| Burglary | 514 | 574.5 | 290.5 | 229.0 |
| Larceny | 1,317 | 1,472.1 | 1,134.4 | 1,272.0 |
| Car Theft | 208 | 232.5 | 290.4 | 259.0 |
Source: FBI Uniform Crime Reporting (2024)
Cost of living in Champaign summary. We use data on the cost of living to determine how expensive it is to live in Champaign. Real estate prices drive most of the variance in cost of living around Illinois. Key points include:
The cost of living in Champaign is 97 with 100 being average.
The cost of living in Champaign is 1.0x lower than the national average.
The median home value in Champaign is $231,273.
The median income in Champaign is $56,118.
Champaign's Overall Cost Of Living
Lower Than The National Average
Cost Of Living In Champaign Comparison Table
| Living Expense | Champaign | Illinois | National Average |
|---|---|---|---|
| Overall | 97 | 98 | 100 |
| Services | 96 | 99 | 100 |
| Groceries | 97 | 99 | 100 |
| Health | 91 | 96 | 100 |
| Housing | 105 | 101 | 100 |
| Transportation | 100 | 99 | 100 |
| Utilities | 97 | 101 | 100 |
Source: Cost of living index, normalized to US average = 100
Champaign, IL Weather
The average high in Champaign is 61.6° and the average low is 41.1°.
There are 74.2 days of precipitation each year.
Expect an average of 39.8 inches of precipitation each year with 21.9 inches of snow.
| Stat | Champaign |
|---|---|
| Average Annual High | 61.6 |
| Average Annual Low | 41.1 |
| Annual Precipitation Days | 74.2 |
| Average Annual Precipitation | 39.8 |
| Average Annual Snowfall | 21.9 |
Average High
Days of Rain
Source: NOAA climate normals (30-year)
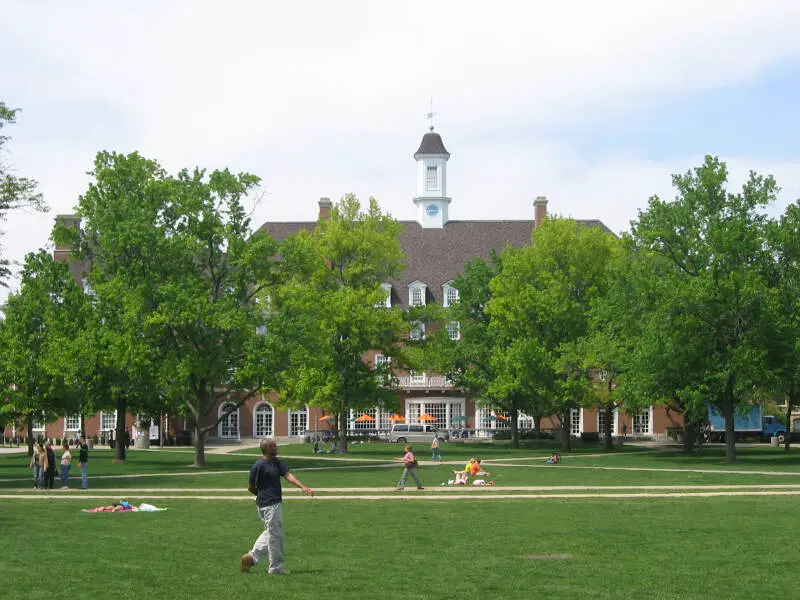
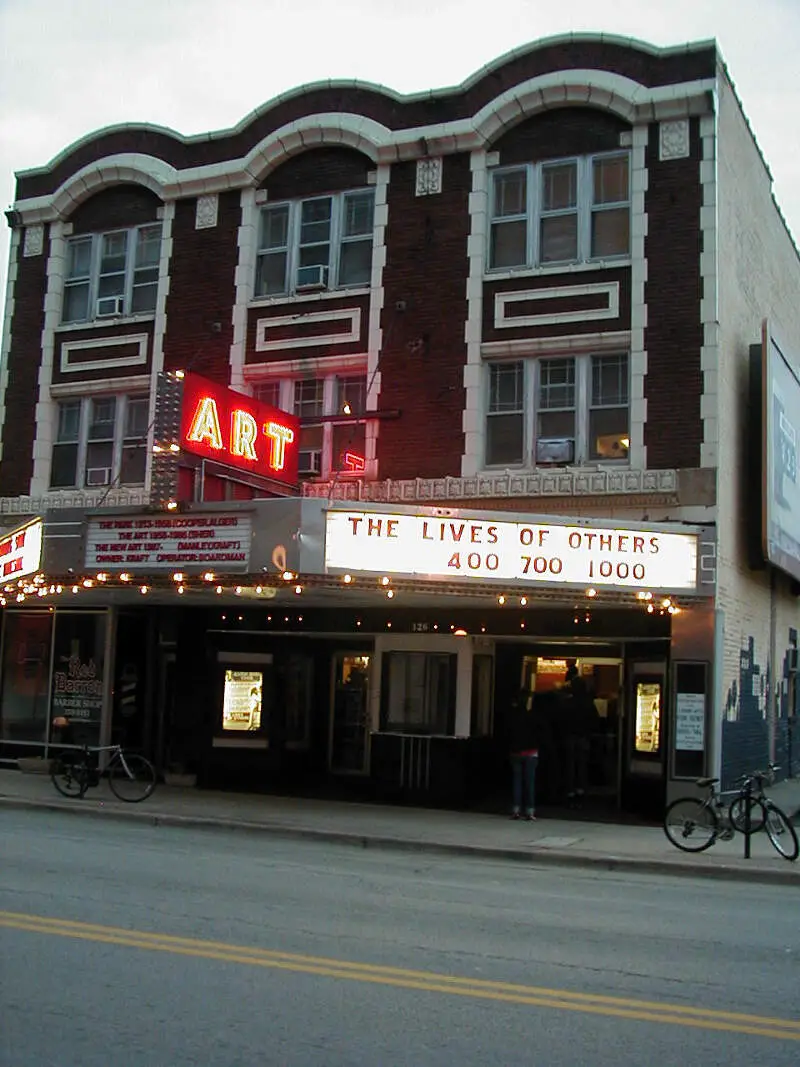
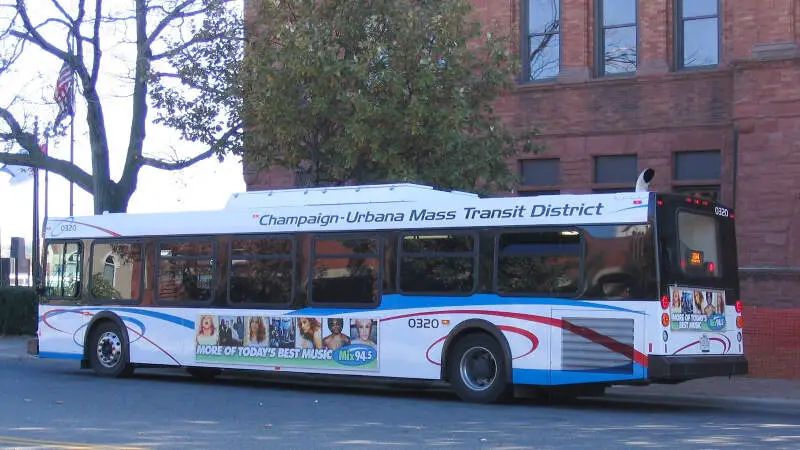
Champaign, IL Photos


1 Reviews & Comments About Champaign

Crime is getting worse by the day as many gangs from Chicago are moving into the area. Schools are not too bad but do not like the fact they use the city bus to transport children to school. It's a college student town so population varies throughout the year.
Going go some of the college sporting events was neat. Not a whole lot to do outside of that. Winters are brutal with nasty winds.
Rankings & Articles For Champaign


Locations Around Champaign
Map Of Champaign, IL
Best Places Around Champaign
Mahomet, IL
Population 10,049
Savoy, IL
Population 8,968
Monticello, IL
Population 6,304
Urbana, IL
Population 39,341
Rantoul, IL
Population 12,421
Champaign Demographics And Statistics
Population over time in Champaign
The current population in Champaign is 89,996. The population has increased 13.3% from 2010.
| Year | Population | % Change |
|---|---|---|
| 2024 | 89,996 | 1.3% |
| 2023 | 88,822 | 0.2% |
| 2022 | 88,628 | 0.3% |
| 2021 | 88,343 | 0.1% |
| 2020 | 88,288 | 0.7% |
| 2019 | 87,636 | 1.0% |
| 2018 | 86,791 | 1.3% |
| 2017 | 85,710 | 1.2% |
| 2016 | 84,672 | 0.8% |
| 2015 | 84,008 | 1.4% |
| 2014 | 82,848 | 1.1% |
| 2013 | 81,925 | 1.0% |
| 2012 | 81,083 | 1.1% |
| 2011 | 80,223 | 1.0% |
| 2010 | 79,430 | - |
Race / Ethnicity in Champaign
See the full breakdown
Champaign is:
54.5% White with 49,054 White residents.
17.2% African American with 15,455 African American residents.
0.1% American Indian with 94 American Indian residents.
15.8% Asian with 14,204 Asian residents.
0.0% Hawaiian with 0 Hawaiian residents.
0.4% Other with 374 Other residents.
4.1% Two Or More with 3,716 Two Or More residents.
7.9% Hispanic with 7,099 Hispanic residents.
| Race | Champaign | IL | USA |
|---|---|---|---|
| White | 54.5% | 58.1% | 57.4% |
| African American | 17.2% | 13.3% | 11.9% |
| American Indian | 0.1% | 0.1% | 0.5% |
| Asian | 15.8% | 5.9% | 5.9% |
| Hawaiian | 0.0% | 0.0% | 0.2% |
| Other | 0.4% | 0.4% | 0.6% |
| Two Or More | 4.1% | 3.4% | 4.3% |
| Hispanic | 7.9% | 18.8% | 19.3% |
Gender in Champaign
See the full breakdown
Champaign is 49.5% female with 44,586 female residents.
Champaign is 50.5% male with 45,410 male residents.
| Gender | Champaign | IL | USA |
|---|---|---|---|
| Female | 49.5% | 50.6% | 50.5% |
| Male | 50.5% | 49.4% | 49.5% |
Highest level of educational attainment in Champaign for adults over 25
See the full breakdown
2.0% of adults in Champaign completed < 9th grade.
3.0% of adults in Champaign completed 9-12th grade.
18.0% of adults in Champaign completed high school / ged.
17.0% of adults in Champaign completed some college.
7.0% of adults in Champaign completed associate's degree.
23.0% of adults in Champaign completed bachelor's degree.
18.0% of adults in Champaign completed master's degree.
4.0% of adults in Champaign completed professional degree.
8.0% of adults in Champaign completed doctorate degree.
| Education | Champaign | IL | USA |
|---|---|---|---|
| < 9th Grade | 2.0% | 5.0% | 4.0% |
| 9-12th Grade | 3.0% | 5.0% | 6.0% |
| High School / GED | 18.0% | 25.0% | 26.0% |
| Some College | 17.0% | 19.0% | 19.0% |
| Associate's Degree | 7.0% | 8.0% | 9.0% |
| Bachelor's Degree | 23.0% | 23.0% | 22.0% |
| Master's Degree | 18.0% | 11.0% | 10.0% |
| Professional Degree | 4.0% | 2.0% | 2.0% |
| Doctorate Degree | 8.0% | 2.0% | 2.0% |
Household Income For Champaign, Illinois
See the full breakdown
17.0% of households in Champaign earn Less than $10,000.
4.8% of households in Champaign earn $10,000 to $14,999.
6.4% of households in Champaign earn $15,000 to $24,999.
8.1% of households in Champaign earn $25,000 to $34,999.
10.1% of households in Champaign earn $35,000 to $49,999.
15.3% of households in Champaign earn $50,000 to $74,999.
10.5% of households in Champaign earn $75,000 to $99,999.
13.1% of households in Champaign earn $100,000 to $149,999.
5.7% of households in Champaign earn $150,000 to $199,999.
9.0% of households in Champaign earn $200,000 or more.
| Income | Champaign | IL | USA |
|---|---|---|---|
| Less than $10,000 | 17.0% | 5.4% | 5.0% |
| $10,000 to $14,999 | 4.8% | 3.2% | 3.4% |
| $15,000 to $24,999 | 6.4% | 5.9% | 6.3% |
| $25,000 to $34,999 | 8.1% | 6.3% | 6.6% |
| $35,000 to $49,999 | 10.1% | 9.7% | 10.1% |
| $50,000 to $74,999 | 15.3% | 14.8% | 15.5% |
| $75,000 to $99,999 | 10.5% | 12.6% | 12.6% |
| $100,000 to $149,999 | 13.1% | 18.0% | 17.5% |
| $150,000 to $199,999 | 5.7% | 10.1% | 9.6% |
| $200,000 or more | 9.0% | 13.8% | 13.4% |
Source: U.S. Census ACS 5-year estimates (2024)


