Urbana, IL
Demographics And Statistics
Living In Urbana, Illinois Summary
Life in Urbana research summary. HomeSnacks has been using Saturday Night Science to research the quality of life in Urbana over the past nine years using Census, FBI, Zillow, and other primary data sources. Based on the most recently available data, we found the following about life in Urbana:
The population in Urbana is 38,447.
The median home value in Urbana is $195,814.
The median income in Urbana is $45,854.
The cost of living in Urbana is 91 which is 0.9x lower than the national average.
The median rent in Urbana is $951.
The unemployment rate in Urbana is 5.7%.
The poverty rate in Urbana is 24.8%.
The average high in Urbana is 61.7° and the average low is 41.3°.
Urbana SnackAbility
Overall SnackAbility
Urbana, IL Crime Report
Crime in Urbana summary. We use data from the FBI to determine the crime rates in Urbana. Key points include:
There were 1,160 total crimes in Urbana in the last reporting year.
The overall crime rate per 100,000 people in Urbana is 3,036.3 / 100k people.
The violent crime rate per 100,000 people in Urbana is 544.4 / 100k people.
The property crime rate per 100,000 people in Urbana is 2,491.9 / 100k people.
Overall, crime in Urbana is 43.27% above the national average.
Total Crimes
Above National Average
Crime In Urbana Comparison Table
| Statistic | Count Raw |
Urbana / 100k People |
Illinois / 100k People |
National / 100k People |
|---|---|---|---|---|
| Total Crimes Per 100K | 1,160 | 3,036.3 | 2,004.4 | 2,119.2 |
| Violent Crime | 208 | 544.4 | 289.2 | 359.0 |
| Murder | 1 | 2.6 | 5.8 | 5.0 |
| Robbery | 31 | 81.1 | 90.2 | 61.0 |
| Aggravated Assault | 155 | 405.7 | 146.3 | 256.0 |
| Property Crime | 952 | 2,491.9 | 1,715.2 | 1,760.0 |
| Burglary | 186 | 486.9 | 290.5 | 229.0 |
| Larceny | 665 | 1,740.7 | 1,134.4 | 1,272.0 |
| Car Theft | 101 | 264.4 | 290.4 | 259.0 |
Urbana, IL Cost Of Living
Cost of living in Urbana summary. We use data on the cost of living to determine how expensive it is to live in Urbana. Real estate prices drive most of the variance in cost of living around Illinois. Key points include:
The cost of living in Urbana is 91 with 100 being average.
The cost of living in Urbana is 0.9x lower than the national average.
The median home value in Urbana is $195,814.
The median income in Urbana is $45,854.
Urbana's Overall Cost Of Living
Lower Than The National Average
Cost Of Living In Urbana Comparison Table
| Living Expense | Urbana | Illinois | National Average | |
|---|---|---|---|---|
| Overall | 91 | 97 | 100 | |
| Services | 102 | 95 | 100 | |
| Groceries | 96 | 99 | 100 | |
| Health | 87 | 93 | 100 | |
| Housing | 84 | 95 | 100 | |
| Transportation | 99 | 102 | 100 | |
| Utilities | 91 | 91 | 100 | |
Urbana, IL Weather
The average high in Urbana is 61.7° and the average low is 41.3°.
There are 74.2 days of precipitation each year.
Expect an average of 39.8 inches of precipitation each year with 22.2 inches of snow.
| Stat | Urbana |
|---|---|
| Average Annual High | 61.7 |
| Average Annual Low | 41.3 |
| Annual Precipitation Days | 74.2 |
| Average Annual Precipitation | 39.8 |
| Average Annual Snowfall | 22.2 |
Average High
Days of Rain
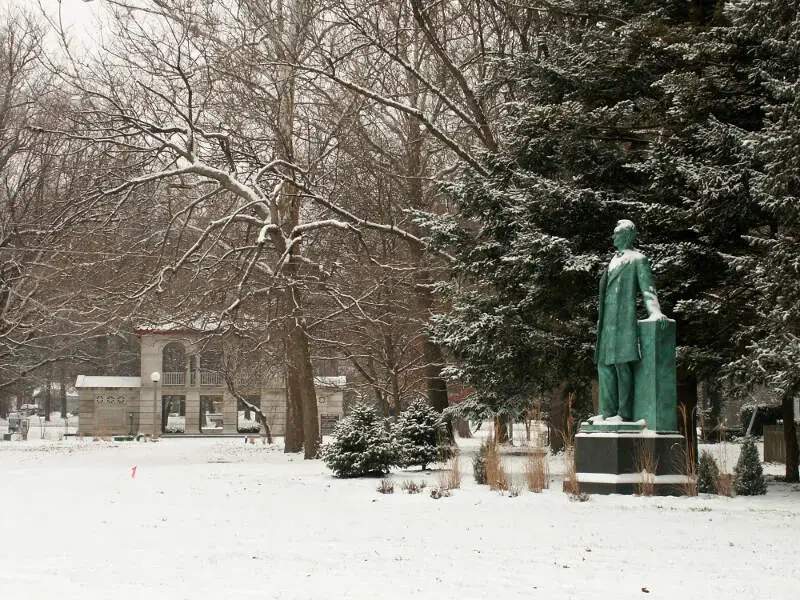
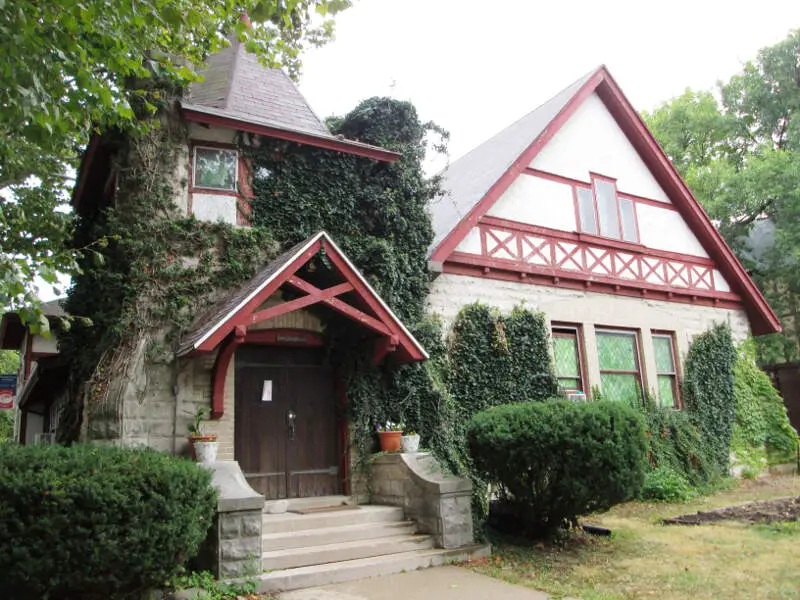
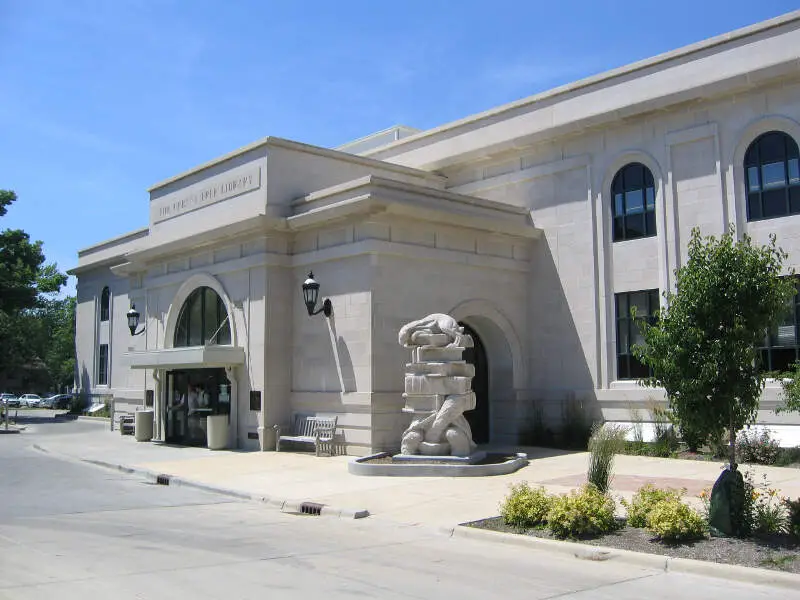
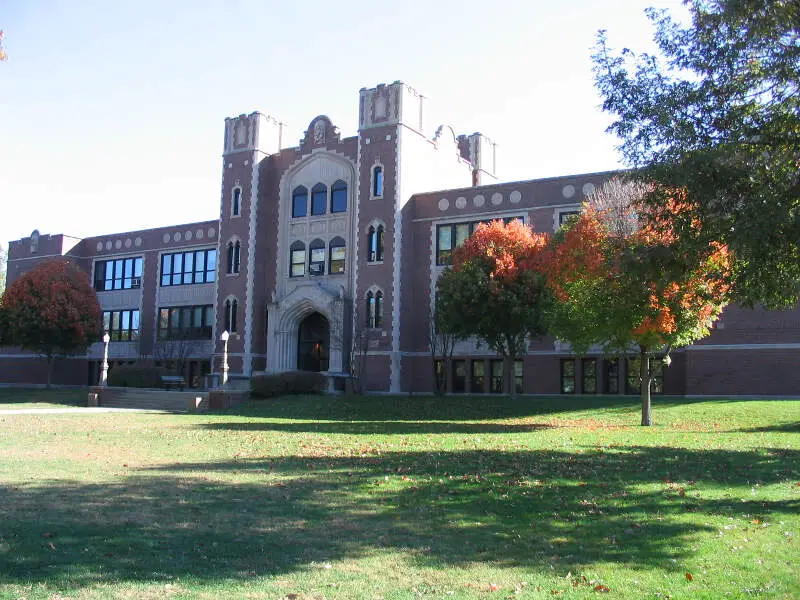
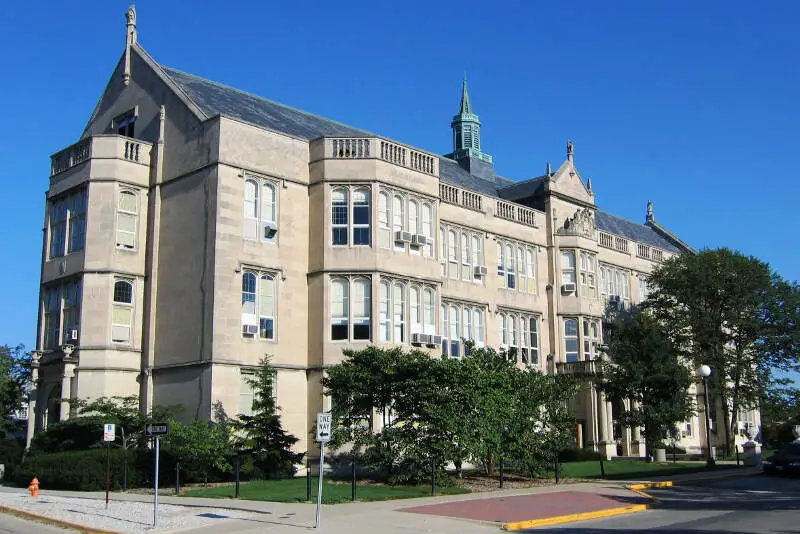
Urbana, IL Photos


Rankings for Urbana in Illinois


Locations Around Urbana
Map Of Urbana, IL
Best Places Around Urbana
Mahomet, IL
Population 9,755
Savoy, IL
Population 8,807
Monticello, IL
Population 6,332
Bloomington, IL
Population 78,703
Champaign, IL
Population 88,822
Mount Zion, IL
Population 6,076
Charleston, IL
Population 17,212
Rantoul, IL
Population 12,515
Mattoon, IL
Population 16,334
Clinton, IL
Population 7,012
Urbana Demographics And Statistics
Population over time in Urbana
The current population in Urbana is 38,447. The population has decreased -5.8% from 2010.
| Year | Population | % Change |
|---|---|---|
| 2023 | 38,447 | -0.8% |
| 2022 | 38,741 | -1.1% |
| 2021 | 39,189 | -7.7% |
| 2020 | 42,461 | -0.6% |
| 2019 | 42,718 | 0.8% |
| 2018 | 42,375 | 0.6% |
| 2017 | 42,141 | 0.5% |
| 2016 | 41,941 | -0.1% |
| 2015 | 41,988 | 0.5% |
| 2014 | 41,760 | 0.6% |
| 2013 | 41,520 | 0.5% |
| 2012 | 41,299 | 0.5% |
| 2011 | 41,089 | 0.7% |
| 2010 | 40,801 | - |
Race / Ethnicity in Urbana
Urbana is:
55.5% White with 21,328 White residents.
16.7% African American with 6,431 African American residents.
0.0% American Indian with 0 American Indian residents.
14.5% Asian with 5,565 Asian residents.
0.1% Hawaiian with 31 Hawaiian residents.
0.3% Other with 130 Other residents.
3.6% Two Or More with 1,378 Two Or More residents.
9.3% Hispanic with 3,584 Hispanic residents.
| Race | Urbana | IL | USA |
|---|---|---|---|
| White | 55.5% | 58.7% | 58.2% |
| African American | 16.7% | 13.6% | 12.0% |
| American Indian | 0.0% | 0.1% | 0.5% |
| Asian | 14.5% | 5.8% | 5.7% |
| Hawaiian | 0.1% | 0.0% | 0.2% |
| Other | 0.3% | 0.3% | 0.5% |
| Two Or More | 3.6% | 3.0% | 3.9% |
| Hispanic | 9.3% | 18.5% | 19.0% |
Gender in Urbana
Urbana is 49.2% female with 18,933 female residents.
Urbana is 50.8% male with 19,513 male residents.
| Gender | Urbana | IL | USA |
|---|---|---|---|
| Female | 49.2% | 50.6% | 50.5% |
| Male | 50.8% | 49.4% | 49.5% |
Highest level of educational attainment in Urbana for adults over 25
1.0% of adults in Urbana completed < 9th grade.
2.0% of adults in Urbana completed 9-12th grade.
19.0% of adults in Urbana completed high school / ged.
13.0% of adults in Urbana completed some college.
6.0% of adults in Urbana completed associate's degree.
21.0% of adults in Urbana completed bachelor's degree.
22.0% of adults in Urbana completed master's degree.
3.0% of adults in Urbana completed professional degree.
13.0% of adults in Urbana completed doctorate degree.
| Education | Urbana | IL | USA |
|---|---|---|---|
| < 9th Grade | 1.0% | 5.0% | 5.0% |
| 9-12th Grade | 2.0% | 5.0% | 6.0% |
| High School / GED | 19.0% | 25.0% | 26.0% |
| Some College | 13.0% | 20.0% | 19.0% |
| Associate's Degree | 6.0% | 8.0% | 9.0% |
| Bachelor's Degree | 21.0% | 22.0% | 21.0% |
| Master's Degree | 22.0% | 11.0% | 10.0% |
| Professional Degree | 3.0% | 2.0% | 2.0% |
| Doctorate Degree | 13.0% | 2.0% | 2.0% |
Household Income For Urbana, Illinois
14.1% of households in Urbana earn Less than $10,000.
5.8% of households in Urbana earn $10,000 to $14,999.
11.8% of households in Urbana earn $15,000 to $24,999.
11.0% of households in Urbana earn $25,000 to $34,999.
9.8% of households in Urbana earn $35,000 to $49,999.
14.6% of households in Urbana earn $50,000 to $74,999.
11.3% of households in Urbana earn $75,000 to $99,999.
9.3% of households in Urbana earn $100,000 to $149,999.
5.7% of households in Urbana earn $150,000 to $199,999.
6.7% of households in Urbana earn $200,000 or more.
| Income | Urbana | IL | USA |
|---|---|---|---|
| Less than $10,000 | 14.1% | 5.2% | 4.9% |
| $10,000 to $14,999 | 5.8% | 3.4% | 3.6% |
| $15,000 to $24,999 | 11.8% | 6.2% | 6.6% |
| $25,000 to $34,999 | 11.0% | 6.5% | 6.8% |
| $35,000 to $49,999 | 9.8% | 9.9% | 10.4% |
| $50,000 to $74,999 | 14.6% | 15.1% | 15.7% |
| $75,000 to $99,999 | 11.3% | 12.7% | 12.7% |
| $100,000 to $149,999 | 9.3% | 17.9% | 17.4% |
| $150,000 to $199,999 | 5.7% | 9.9% | 9.3% |
| $200,000 or more | 6.7% | 13.1% | 12.6% |


