Crystal Lake SnackAbility
Overall SnackAbility
Crime in Crystal Lake summary. We use data from the FBI to determine the crime rates in Crystal Lake. Key points include:
There were 496 total crimes in Crystal Lake in the last reporting year.
The overall crime rate per 100,000 people in Crystal Lake is 1,207.6 / 100k people.
The violent crime rate per 100,000 people in Crystal Lake is 104.7 / 100k people.
The property crime rate per 100,000 people in Crystal Lake is 1,102.9 / 100k people.
Overall, crime in Crystal Lake is -43.02% below the national average.
Total Crimes
Below National Average
Crime In Crystal Lake Comparison Table
| Statistic | Count Raw |
Crystal Lake / 100k People |
Illinois / 100k People |
National / 100k People |
|---|---|---|---|---|
| Total Crimes Per 100K | 496 | 1,207.6 | 2,004.4 | 2,119.2 |
| Violent Crime | 43 | 104.7 | 289.2 | 359.0 |
| Murder | 0 | 0.0 | 5.8 | 5.0 |
| Robbery | 2 | 4.9 | 90.2 | 61.0 |
| Aggravated Assault | 21 | 51.1 | 146.3 | 256.0 |
| Property Crime | 453 | 1,102.9 | 1,715.2 | 1,760.0 |
| Burglary | 42 | 102.3 | 290.5 | 229.0 |
| Larceny | 381 | 927.6 | 1,134.4 | 1,272.0 |
| Car Theft | 30 | 73.0 | 290.4 | 259.0 |
Source: FBI Uniform Crime Reporting (2024)
Cost of living in Crystal Lake summary. We use data on the cost of living to determine how expensive it is to live in Crystal Lake. Real estate prices drive most of the variance in cost of living around Illinois. Key points include:
The cost of living in Crystal Lake is 107 with 100 being average.
The cost of living in Crystal Lake is 1.1x higher than the national average.
The median home value in Crystal Lake is $374,459.
The median income in Crystal Lake is $108,418.
Crystal Lake's Overall Cost Of Living
Higher Than The National Average
Cost Of Living In Crystal Lake Comparison Table
| Living Expense | Crystal Lake | Illinois | National Average |
|---|---|---|---|
| Overall | 107 | 98 | 100 |
| Services | 100 | 99 | 100 |
| Groceries | 102 | 99 | 100 |
| Health | 124 | 96 | 100 |
| Housing | 98 | 101 | 100 |
| Transportation | 99 | 99 | 100 |
| Utilities | 98 | 101 | 100 |
Source: Cost of living index, normalized to US average = 100
Crystal Lake, IL Weather
The average high in Crystal Lake is 57.9° and the average low is 37.7°.
There are 73.0 days of precipitation each year.
Expect an average of 36.9 inches of precipitation each year with 33.8 inches of snow.
| Stat | Crystal Lake |
|---|---|
| Average Annual High | 57.9 |
| Average Annual Low | 37.7 |
| Annual Precipitation Days | 73.0 |
| Average Annual Precipitation | 36.9 |
| Average Annual Snowfall | 33.8 |
Average High
Days of Rain
Source: NOAA climate normals (30-year)
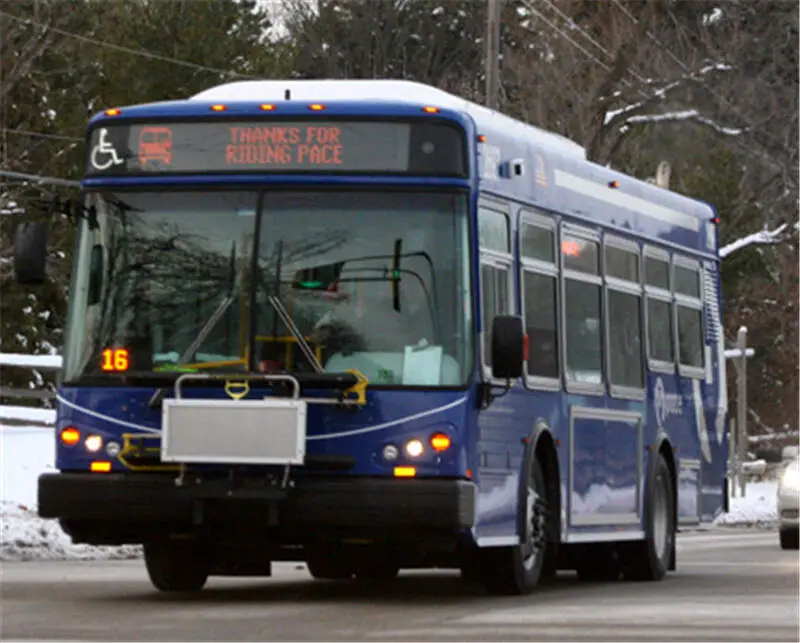
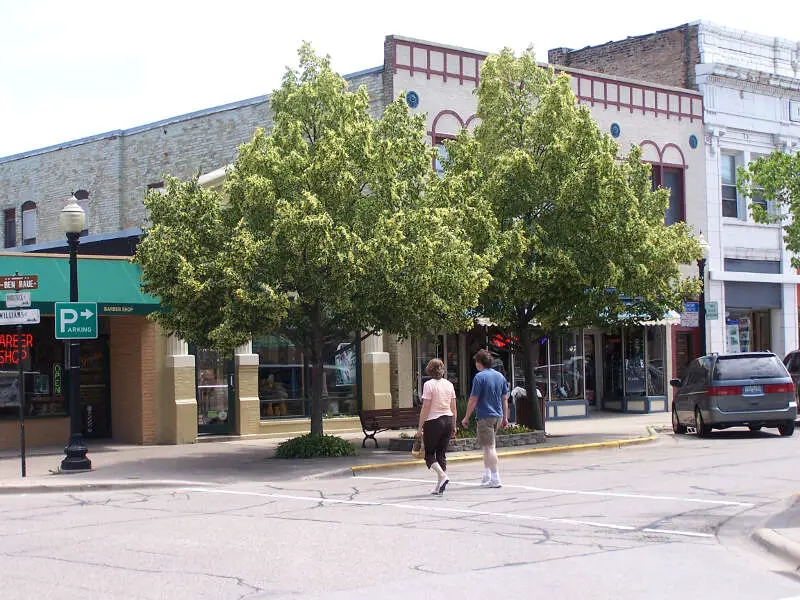
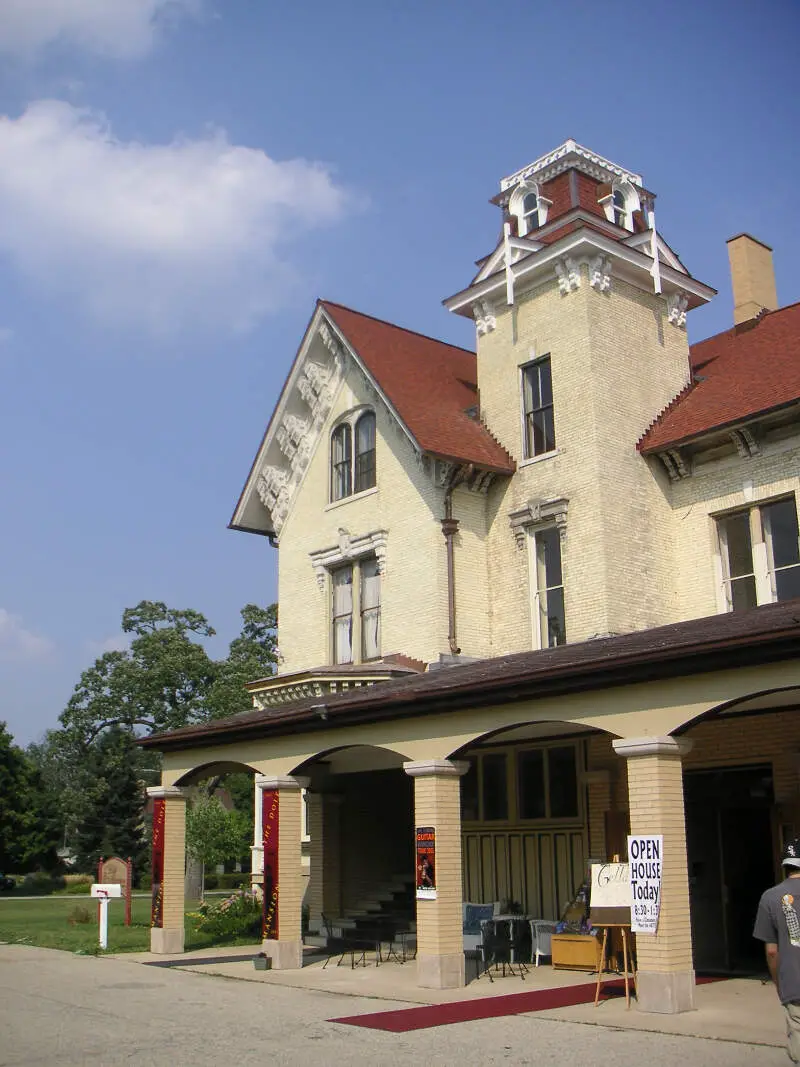
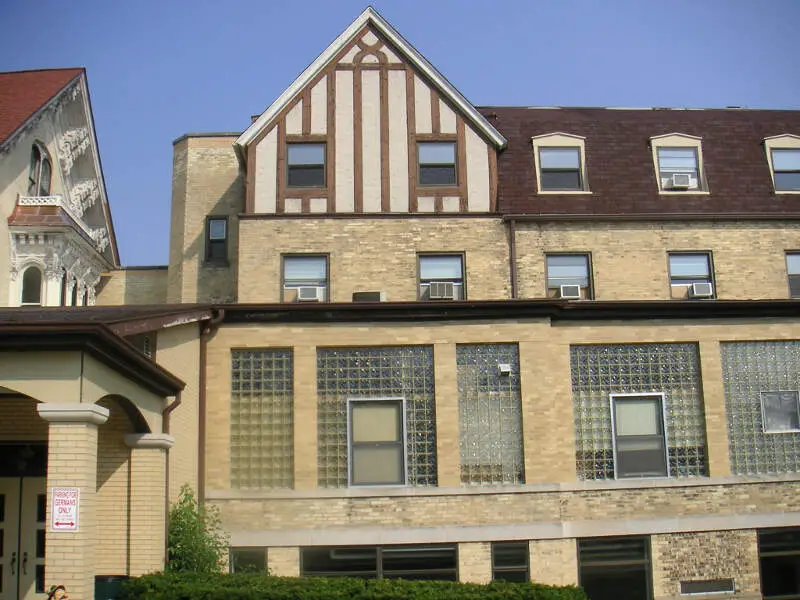
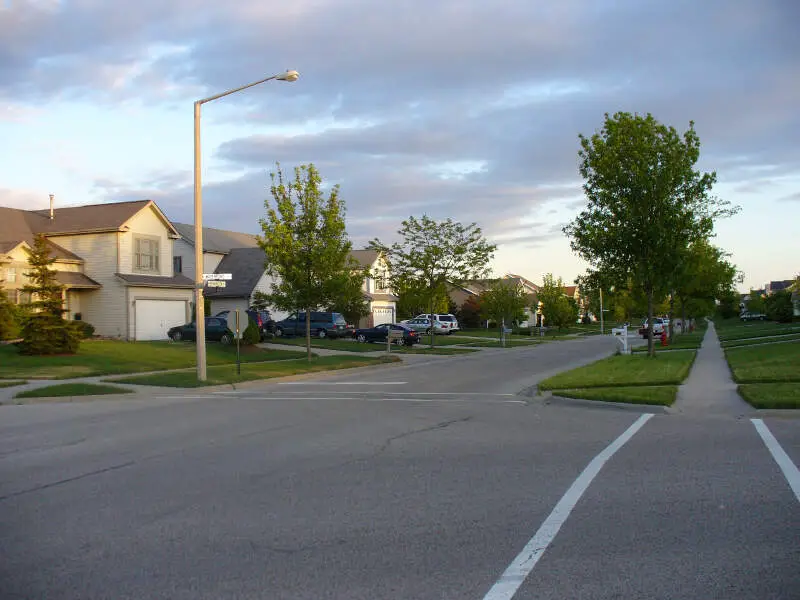
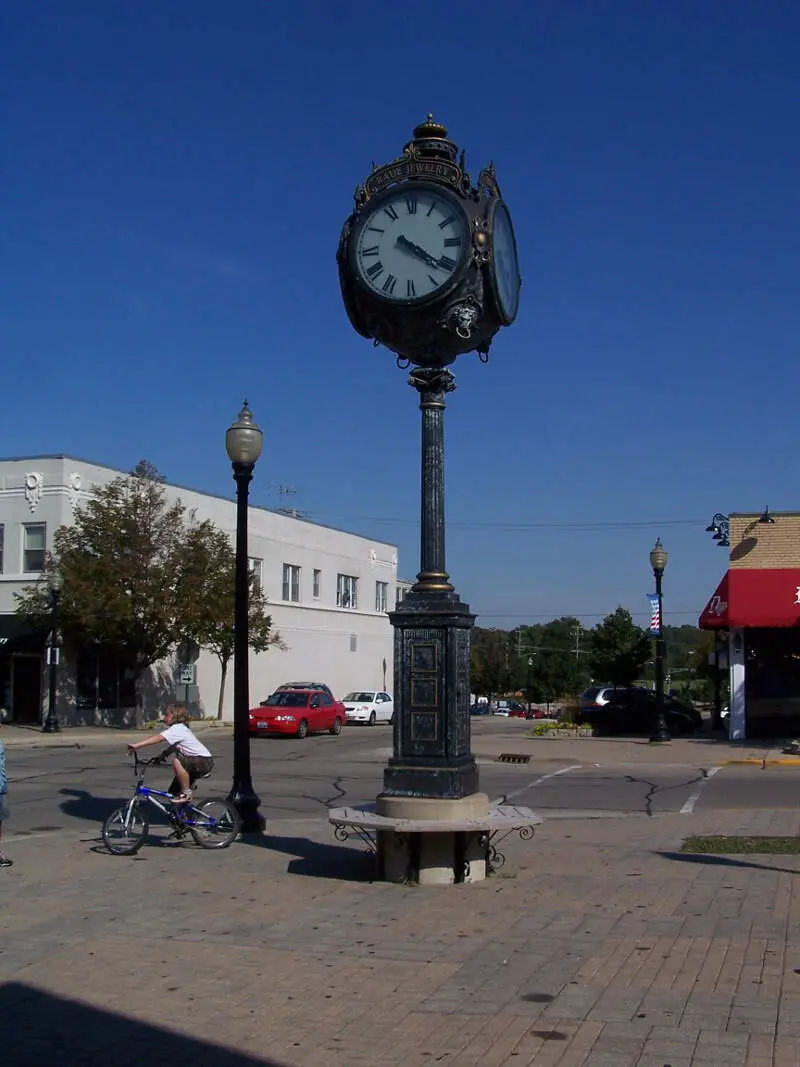
Crystal Lake, IL Photos
Rankings & Articles For Crystal Lake


Locations Around Crystal Lake
Map Of Crystal Lake, IL
Best Places Around Crystal Lake
Buffalo Grove, IL
Population 42,891
Lake Zurich, IL
Population 19,832
Bartlett, IL
Population 40,501
Hawthorn Woods, IL
Population 9,143
Vernon Hills, IL
Population 26,876
Libertyville, IL
Population 20,525
Hoffman Estates, IL
Population 51,175
Long Grove, IL
Population 8,305
Palatine, IL
Population 66,293
Mundelein, IL
Population 31,915
Crystal Lake Demographics And Statistics
Population over time in Crystal Lake
The current population in Crystal Lake is 40,579. The population has decreased 1.1% from 2010.
| Year | Population | % Change |
|---|---|---|
| 2024 | 40,579 | 0.4% |
| 2023 | 40,436 | -0.1% |
| 2022 | 40,463 | 1.0% |
| 2021 | 40,082 | 1.0% |
| 2020 | 39,685 | -0.7% |
| 2019 | 39,974 | -0.5% |
| 2018 | 40,170 | -0.4% |
| 2017 | 40,331 | -0.4% |
| 2016 | 40,475 | -0.4% |
| 2015 | 40,635 | 0.1% |
| 2014 | 40,598 | -0.0% |
| 2013 | 40,609 | -0.6% |
| 2012 | 40,867 | -0.4% |
| 2011 | 41,027 | -0.0% |
| 2010 | 41,044 | - |
Race / Ethnicity in Crystal Lake
See the full breakdown
Crystal Lake is:
78.3% White with 31,776 White residents.
0.6% African American with 250 African American residents.
0.1% American Indian with 58 American Indian residents.
3.7% Asian with 1,515 Asian residents.
0.0% Hawaiian with 0 Hawaiian residents.
0.3% Other with 111 Other residents.
3.1% Two Or More with 1,269 Two Or More residents.
13.8% Hispanic with 5,600 Hispanic residents.
| Race | Crystal Lake | IL | USA |
|---|---|---|---|
| White | 78.3% | 58.1% | 57.4% |
| African American | 0.6% | 13.3% | 11.9% |
| American Indian | 0.1% | 0.1% | 0.5% |
| Asian | 3.7% | 5.9% | 5.9% |
| Hawaiian | 0.0% | 0.0% | 0.2% |
| Other | 0.3% | 0.4% | 0.6% |
| Two Or More | 3.1% | 3.4% | 4.3% |
| Hispanic | 13.8% | 18.8% | 19.3% |
Gender in Crystal Lake
See the full breakdown
Crystal Lake is 50.6% female with 20,526 female residents.
Crystal Lake is 49.4% male with 20,053 male residents.
| Gender | Crystal Lake | IL | USA |
|---|---|---|---|
| Female | 50.6% | 50.6% | 50.5% |
| Male | 49.4% | 49.4% | 49.5% |
Highest level of educational attainment in Crystal Lake for adults over 25
See the full breakdown
4.0% of adults in Crystal Lake completed < 9th grade.
4.0% of adults in Crystal Lake completed 9-12th grade.
23.0% of adults in Crystal Lake completed high school / ged.
20.0% of adults in Crystal Lake completed some college.
8.0% of adults in Crystal Lake completed associate's degree.
28.0% of adults in Crystal Lake completed bachelor's degree.
11.0% of adults in Crystal Lake completed master's degree.
1.0% of adults in Crystal Lake completed professional degree.
1.0% of adults in Crystal Lake completed doctorate degree.
| Education | Crystal Lake | IL | USA |
|---|---|---|---|
| < 9th Grade | 4.0% | 5.0% | 4.0% |
| 9-12th Grade | 4.0% | 5.0% | 6.0% |
| High School / GED | 23.0% | 25.0% | 26.0% |
| Some College | 20.0% | 19.0% | 19.0% |
| Associate's Degree | 8.0% | 8.0% | 9.0% |
| Bachelor's Degree | 28.0% | 23.0% | 22.0% |
| Master's Degree | 11.0% | 11.0% | 10.0% |
| Professional Degree | 1.0% | 2.0% | 2.0% |
| Doctorate Degree | 1.0% | 2.0% | 2.0% |
Household Income For Crystal Lake, Illinois
See the full breakdown
1.9% of households in Crystal Lake earn Less than $10,000.
1.9% of households in Crystal Lake earn $10,000 to $14,999.
3.2% of households in Crystal Lake earn $15,000 to $24,999.
4.7% of households in Crystal Lake earn $25,000 to $34,999.
7.4% of households in Crystal Lake earn $35,000 to $49,999.
13.4% of households in Crystal Lake earn $50,000 to $74,999.
13.2% of households in Crystal Lake earn $75,000 to $99,999.
22.3% of households in Crystal Lake earn $100,000 to $149,999.
16.4% of households in Crystal Lake earn $150,000 to $199,999.
15.5% of households in Crystal Lake earn $200,000 or more.
| Income | Crystal Lake | IL | USA |
|---|---|---|---|
| Less than $10,000 | 1.9% | 5.4% | 5.0% |
| $10,000 to $14,999 | 1.9% | 3.2% | 3.4% |
| $15,000 to $24,999 | 3.2% | 5.9% | 6.3% |
| $25,000 to $34,999 | 4.7% | 6.3% | 6.6% |
| $35,000 to $49,999 | 7.4% | 9.7% | 10.1% |
| $50,000 to $74,999 | 13.4% | 14.8% | 15.5% |
| $75,000 to $99,999 | 13.2% | 12.6% | 12.6% |
| $100,000 to $149,999 | 22.3% | 18.0% | 17.5% |
| $150,000 to $199,999 | 16.4% | 10.1% | 9.6% |
| $200,000 or more | 15.5% | 13.8% | 13.4% |
Source: U.S. Census ACS 5-year estimates (2024)


