O'fallon SnackAbility
Overall SnackAbility
Crime in O'Fallon summary. We use data from the FBI to determine the crime rates in O'Fallon. Key points include:
There were 387 total crimes in O'Fallon in the last reporting year.
The overall crime rate per 100,000 people in O'Fallon is 1,214.8 / 100k people.
The violent crime rate per 100,000 people in O'Fallon is 194.6 / 100k people.
The property crime rate per 100,000 people in O'Fallon is 1,020.2 / 100k people.
Overall, crime in O'Fallon is -42.68% below the national average.
Total Crimes
Below National Average
Crime In O'Fallon Comparison Table
| Statistic | Count Raw |
O'Fallon / 100k People |
Illinois / 100k People |
National / 100k People |
|---|---|---|---|---|
| Total Crimes Per 100K | 387 | 1,214.8 | 2,004.4 | 2,119.2 |
| Violent Crime | 62 | 194.6 | 289.2 | 359.0 |
| Murder | 1 | 3.1 | 5.8 | 5.0 |
| Robbery | 4 | 12.6 | 90.2 | 61.0 |
| Aggravated Assault | 47 | 147.5 | 146.3 | 256.0 |
| Property Crime | 325 | 1,020.2 | 1,715.2 | 1,760.0 |
| Burglary | 58 | 182.1 | 290.5 | 229.0 |
| Larceny | 216 | 678.1 | 1,134.4 | 1,272.0 |
| Car Theft | 51 | 160.1 | 290.4 | 259.0 |
Source: FBI Uniform Crime Reporting (2024)
Cost of living in O'Fallon summary. We use data on the cost of living to determine how expensive it is to live in O'Fallon. Real estate prices drive most of the variance in cost of living around Illinois. Key points include:
The cost of living in O'Fallon is 107 with 100 being average.
The cost of living in O'Fallon is 1.1x higher than the national average.
The median home value in O'Fallon is $308,470.
The median income in O'Fallon is $105,982.
O'fallon's Overall Cost Of Living
Higher Than The National Average
Cost Of Living In O'Fallon Comparison Table
| Living Expense | O'Fallon | Illinois | National Average |
|---|---|---|---|
| Overall | 107 | 98 | 100 |
| Services | 102 | 99 | 100 |
| Groceries | 99 | 99 | 100 |
| Health | 120 | 96 | 100 |
| Housing | 99 | 101 | 100 |
| Transportation | 103 | 99 | 100 |
| Utilities | 98 | 101 | 100 |
Source: Cost of living index, normalized to US average = 100
O'fallon, IL Weather
The average high in O'Fallon is 65.8° and the average low is 45.9°.
There are 69.2 days of precipitation each year.
Expect an average of 41.2 inches of precipitation each year with 12.5 inches of snow.
| Stat | O'Fallon |
|---|---|
| Average Annual High | 65.8 |
| Average Annual Low | 45.9 |
| Annual Precipitation Days | 69.2 |
| Average Annual Precipitation | 41.2 |
| Average Annual Snowfall | 12.5 |
Average High
Days of Rain
Source: NOAA climate normals (30-year)
O'fallon, IL Photos


Rankings & Articles For O'Fallon


Locations Around O'Fallon
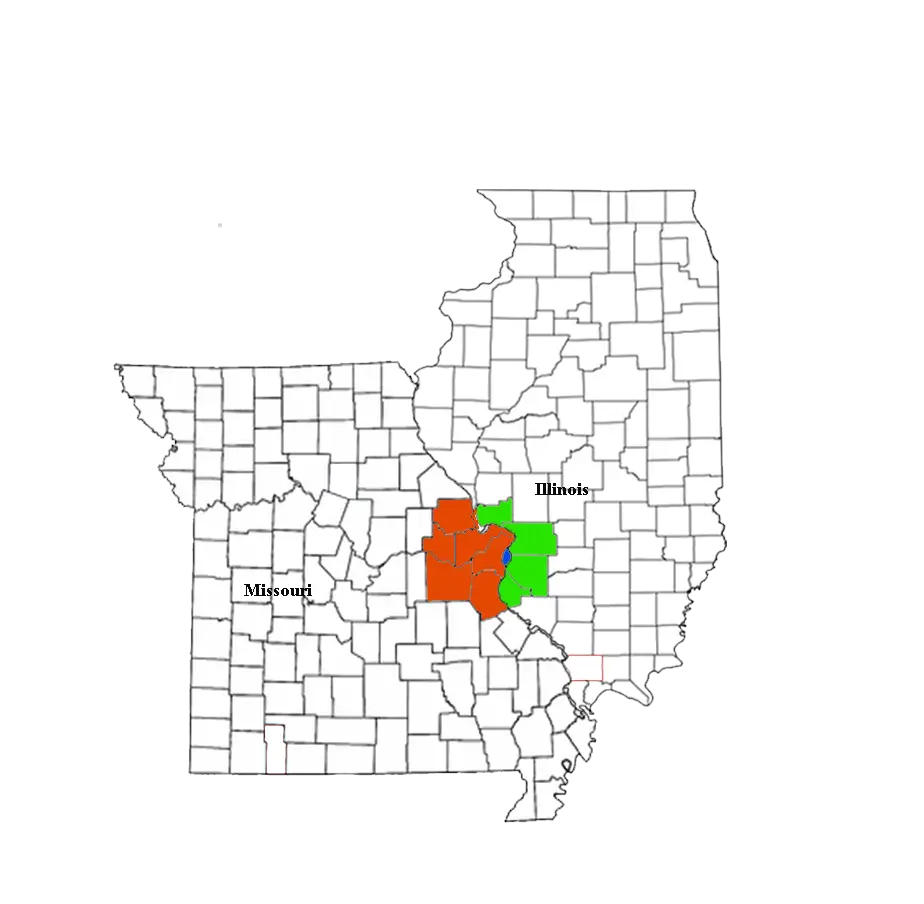
Map Of O'Fallon, IL
Best Places Around O'Fallon
Maryville, IL
Population 8,316
Troy, IL
Population 11,647
Shiloh, IL
Population 14,572
Swansea, IL
Population 14,710
Columbia, IL
Population 11,127
Edwardsville, IL
Population 26,474
Mascoutah, IL
Population 8,816
Glen Carbon, IL
Population 13,977
Highland, IL
Population 10,262
Fairview Heights, IL
Population 16,745
O'Fallon Demographics And Statistics
Population over time in O'Fallon
The current population in O'Fallon is 32,262. The population has increased 19.3% from 2010.
| Year | Population | % Change |
|---|---|---|
| 2024 | 32,262 | 0.4% |
| 2023 | 32,139 | 0.1% |
| 2022 | 32,104 | 0.4% |
| 2021 | 31,963 | 8.4% |
| 2020 | 29,487 | 0.5% |
| 2019 | 29,333 | 0.2% |
| 2018 | 29,277 | 0.6% |
| 2017 | 29,095 | 0.1% |
| 2016 | 29,078 | -0.2% |
| 2015 | 29,144 | 0.2% |
| 2014 | 29,100 | 0.9% |
| 2013 | 28,844 | 1.6% |
| 2012 | 28,377 | 2.9% |
| 2011 | 27,566 | 1.9% |
| 2010 | 27,044 | - |
Race / Ethnicity in O'Fallon
See the full breakdown
O'Fallon is:
69.4% White with 22,382 White residents.
16.5% African American with 5,335 African American residents.
0.1% American Indian with 25 American Indian residents.
2.6% Asian with 833 Asian residents.
0.0% Hawaiian with 0 Hawaiian residents.
0.4% Other with 145 Other residents.
5.8% Two Or More with 1,881 Two Or More residents.
5.1% Hispanic with 1,661 Hispanic residents.
| Race | O'Fallon | IL | USA |
|---|---|---|---|
| White | 69.4% | 58.1% | 57.4% |
| African American | 16.5% | 13.3% | 11.9% |
| American Indian | 0.1% | 0.1% | 0.5% |
| Asian | 2.6% | 5.9% | 5.9% |
| Hawaiian | 0.0% | 0.0% | 0.2% |
| Other | 0.4% | 0.4% | 0.6% |
| Two Or More | 5.8% | 3.4% | 4.3% |
| Hispanic | 5.1% | 18.8% | 19.3% |
Gender in O'Fallon
See the full breakdown
O'Fallon is 50.5% female with 16,284 female residents.
O'Fallon is 49.5% male with 15,977 male residents.
| Gender | O'Fallon | IL | USA |
|---|---|---|---|
| Female | 50.5% | 50.6% | 50.5% |
| Male | 49.5% | 49.4% | 49.5% |
Highest level of educational attainment in O'Fallon for adults over 25
See the full breakdown
0.0% of adults in O'Fallon completed < 9th grade.
2.0% of adults in O'Fallon completed 9-12th grade.
17.0% of adults in O'Fallon completed high school / ged.
18.0% of adults in O'Fallon completed some college.
11.0% of adults in O'Fallon completed associate's degree.
29.0% of adults in O'Fallon completed bachelor's degree.
20.0% of adults in O'Fallon completed master's degree.
2.0% of adults in O'Fallon completed professional degree.
1.0% of adults in O'Fallon completed doctorate degree.
| Education | O'Fallon | IL | USA |
|---|---|---|---|
| < 9th Grade | 0.0% | 5.0% | 4.0% |
| 9-12th Grade | 2.0% | 5.0% | 6.0% |
| High School / GED | 17.0% | 25.0% | 26.0% |
| Some College | 18.0% | 19.0% | 19.0% |
| Associate's Degree | 11.0% | 8.0% | 9.0% |
| Bachelor's Degree | 29.0% | 23.0% | 22.0% |
| Master's Degree | 20.0% | 11.0% | 10.0% |
| Professional Degree | 2.0% | 2.0% | 2.0% |
| Doctorate Degree | 1.0% | 2.0% | 2.0% |
Household Income For O'Fallon, Illinois
See the full breakdown
3.0% of households in O'Fallon earn Less than $10,000.
2.0% of households in O'Fallon earn $10,000 to $14,999.
4.6% of households in O'Fallon earn $15,000 to $24,999.
5.1% of households in O'Fallon earn $25,000 to $34,999.
6.9% of households in O'Fallon earn $35,000 to $49,999.
15.4% of households in O'Fallon earn $50,000 to $74,999.
10.7% of households in O'Fallon earn $75,000 to $99,999.
20.1% of households in O'Fallon earn $100,000 to $149,999.
12.0% of households in O'Fallon earn $150,000 to $199,999.
20.3% of households in O'Fallon earn $200,000 or more.
| Income | O'Fallon | IL | USA |
|---|---|---|---|
| Less than $10,000 | 3.0% | 5.4% | 5.0% |
| $10,000 to $14,999 | 2.0% | 3.2% | 3.4% |
| $15,000 to $24,999 | 4.6% | 5.9% | 6.3% |
| $25,000 to $34,999 | 5.1% | 6.3% | 6.6% |
| $35,000 to $49,999 | 6.9% | 9.7% | 10.1% |
| $50,000 to $74,999 | 15.4% | 14.8% | 15.5% |
| $75,000 to $99,999 | 10.7% | 12.6% | 12.6% |
| $100,000 to $149,999 | 20.1% | 18.0% | 17.5% |
| $150,000 to $199,999 | 12.0% | 10.1% | 9.6% |
| $200,000 or more | 20.3% | 13.8% | 13.4% |
Source: U.S. Census ACS 5-year estimates (2024)


