Waterloo, IL
Demographics And Statistics
Living In Waterloo, Illinois Summary
Life in Waterloo research summary. HomeSnacks has been using Saturday Night Science to research the quality of life in Waterloo over the past nine years using Census, FBI, Zillow, and other primary data sources. Based on the most recently available data, we found the following about life in Waterloo:
The population in Waterloo is 11,055.
The median home value in Waterloo is $329,678.
The median income in Waterloo is $92,005.
The cost of living in Waterloo is 94 which is 0.9x lower than the national average.
The median rent in Waterloo is $873.
The unemployment rate in Waterloo is 3.4%.
The poverty rate in Waterloo is 5.5%.
The average high in Waterloo is 65.7° and the average low is 46.3°.
Table Of Contents
Waterloo SnackAbility
Overall SnackAbility
Waterloo, IL Cost Of Living
Cost of living in Waterloo summary. We use data on the cost of living to determine how expensive it is to live in Waterloo. Real estate prices drive most of the variance in cost of living around Illinois. Key points include:
The cost of living in Waterloo is 94 with 100 being average.
The cost of living in Waterloo is 0.9x lower than the national average.
The median home value in Waterloo is $329,678.
The median income in Waterloo is $92,005.
Waterloo's Overall Cost Of Living
Lower Than The National Average
Cost Of Living In Waterloo Comparison Table
| Living Expense | Waterloo | Illinois | National Average | |
|---|---|---|---|---|
| Overall | 94 | 97 | 100 | |
| Services | 94 | 95 | 100 | |
| Groceries | 98 | 99 | 100 | |
| Health | 90 | 93 | 100 | |
| Housing | 104 | 95 | 100 | |
| Transportation | 96 | 102 | 100 | |
| Utilities | 103 | 91 | 100 | |
Waterloo, IL Weather
The average high in Waterloo is 65.7° and the average low is 46.3°.
There are 65.2 days of precipitation each year.
Expect an average of 42.9 inches of precipitation each year with 11.7 inches of snow.
| Stat | Waterloo |
|---|---|
| Average Annual High | 65.7 |
| Average Annual Low | 46.3 |
| Annual Precipitation Days | 65.2 |
| Average Annual Precipitation | 42.9 |
| Average Annual Snowfall | 11.7 |
Average High
Days of Rain
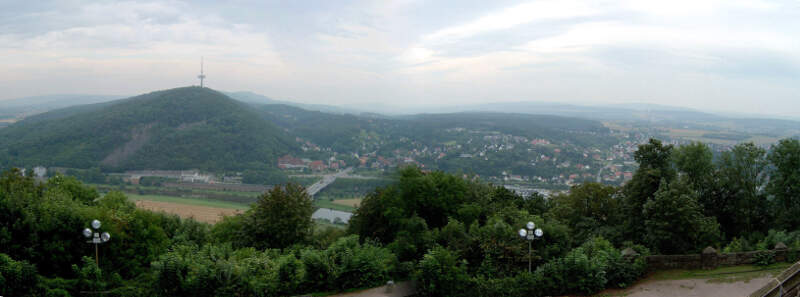
Waterloo, IL Photos
Rankings for Waterloo in Illinois


Locations Around Waterloo
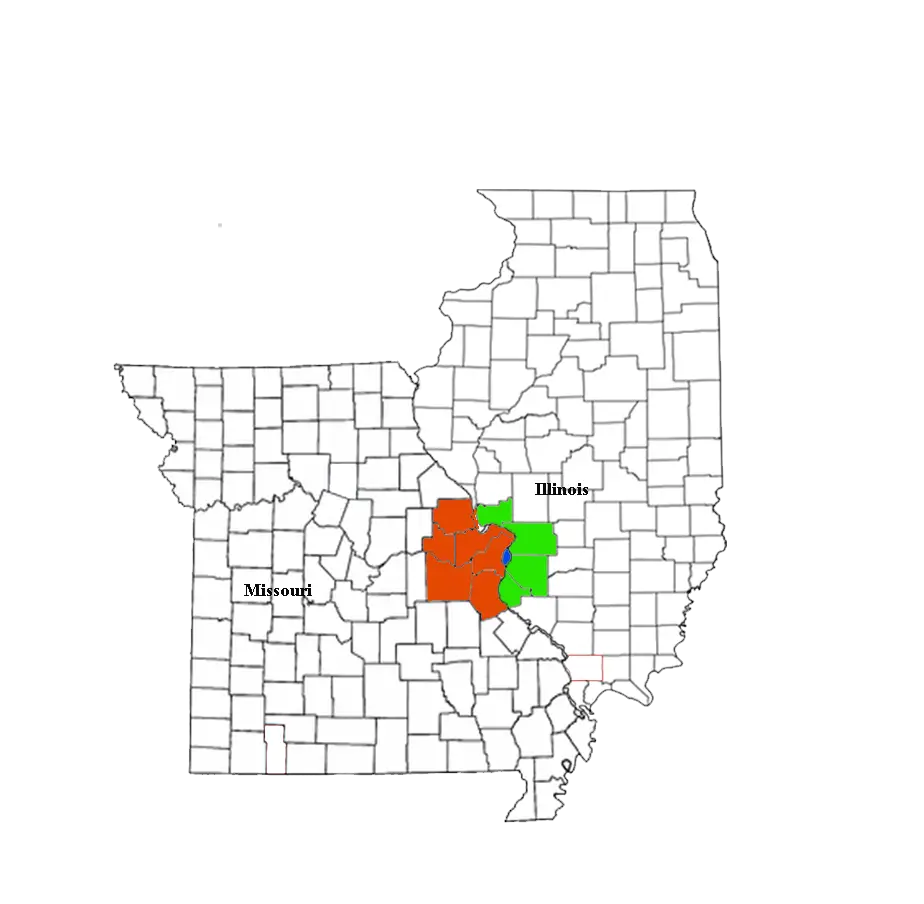
Map Of Waterloo, IL
Best Places Around Waterloo
Shiloh, IL
Population 14,109
Swansea, IL
Population 14,603
Columbia, IL
Population 11,063
Fairview Heights, IL
Population 16,255
Belleville, IL
Population 41,722
Oakville, MO
Population 35,166
Concord, MO
Population 18,028
Sunset Hills, MO
Population 9,113
Affton, MO
Population 20,035
Shrewsbury, MO
Population 6,328
Waterloo Demographics And Statistics
Population over time in Waterloo
The current population in Waterloo is 11,055. The population has increased 14.7% from 2010.
| Year | Population | % Change |
|---|---|---|
| 2023 | 11,055 | 0.4% |
| 2022 | 11,012 | 1.0% |
| 2021 | 10,906 | 4.7% |
| 2020 | 10,417 | 0.5% |
| 2019 | 10,367 | 1.0% |
| 2018 | 10,268 | 0.6% |
| 2017 | 10,202 | 0.0% |
| 2016 | 10,197 | 0.5% |
| 2015 | 10,151 | 0.5% |
| 2014 | 10,102 | 0.9% |
| 2013 | 10,015 | 1.9% |
| 2012 | 9,826 | 0.8% |
| 2011 | 9,749 | 1.1% |
| 2010 | 9,640 | - |
Race / Ethnicity in Waterloo
Waterloo is:
95.4% White with 10,549 White residents.
0.8% African American with 90 African American residents.
0.1% American Indian with 16 American Indian residents.
1.1% Asian with 123 Asian residents.
0.0% Hawaiian with 0 Hawaiian residents.
0.0% Other with 0 Other residents.
0.8% Two Or More with 85 Two Or More residents.
1.7% Hispanic with 192 Hispanic residents.
| Race | Waterloo | IL | USA |
|---|---|---|---|
| White | 95.4% | 58.7% | 58.2% |
| African American | 0.8% | 13.6% | 12.0% |
| American Indian | 0.1% | 0.1% | 0.5% |
| Asian | 1.1% | 5.8% | 5.7% |
| Hawaiian | 0.0% | 0.0% | 0.2% |
| Other | 0.0% | 0.3% | 0.5% |
| Two Or More | 0.8% | 3.0% | 3.9% |
| Hispanic | 1.7% | 18.5% | 19.0% |
Gender in Waterloo
Waterloo is 50.8% female with 5,612 female residents.
Waterloo is 49.2% male with 5,442 male residents.
| Gender | Waterloo | IL | USA |
|---|---|---|---|
| Female | 50.8% | 50.6% | 50.5% |
| Male | 49.2% | 49.4% | 49.5% |
Highest level of educational attainment in Waterloo for adults over 25
0.0% of adults in Waterloo completed < 9th grade.
3.0% of adults in Waterloo completed 9-12th grade.
22.0% of adults in Waterloo completed high school / ged.
28.0% of adults in Waterloo completed some college.
10.0% of adults in Waterloo completed associate's degree.
24.0% of adults in Waterloo completed bachelor's degree.
9.0% of adults in Waterloo completed master's degree.
2.0% of adults in Waterloo completed professional degree.
2.0% of adults in Waterloo completed doctorate degree.
| Education | Waterloo | IL | USA |
|---|---|---|---|
| < 9th Grade | 0.0% | 5.0% | 5.0% |
| 9-12th Grade | 3.0% | 5.0% | 6.0% |
| High School / GED | 22.0% | 25.0% | 26.0% |
| Some College | 28.0% | 20.0% | 19.0% |
| Associate's Degree | 10.0% | 8.0% | 9.0% |
| Bachelor's Degree | 24.0% | 22.0% | 21.0% |
| Master's Degree | 9.0% | 11.0% | 10.0% |
| Professional Degree | 2.0% | 2.0% | 2.0% |
| Doctorate Degree | 2.0% | 2.0% | 2.0% |
Household Income For Waterloo, Illinois
2.5% of households in Waterloo earn Less than $10,000.
3.4% of households in Waterloo earn $10,000 to $14,999.
6.3% of households in Waterloo earn $15,000 to $24,999.
5.9% of households in Waterloo earn $25,000 to $34,999.
6.6% of households in Waterloo earn $35,000 to $49,999.
15.3% of households in Waterloo earn $50,000 to $74,999.
13.8% of households in Waterloo earn $75,000 to $99,999.
20.1% of households in Waterloo earn $100,000 to $149,999.
17.5% of households in Waterloo earn $150,000 to $199,999.
8.6% of households in Waterloo earn $200,000 or more.
| Income | Waterloo | IL | USA |
|---|---|---|---|
| Less than $10,000 | 2.5% | 5.2% | 4.9% |
| $10,000 to $14,999 | 3.4% | 3.4% | 3.6% |
| $15,000 to $24,999 | 6.3% | 6.2% | 6.6% |
| $25,000 to $34,999 | 5.9% | 6.5% | 6.8% |
| $35,000 to $49,999 | 6.6% | 9.9% | 10.4% |
| $50,000 to $74,999 | 15.3% | 15.1% | 15.7% |
| $75,000 to $99,999 | 13.8% | 12.7% | 12.7% |
| $100,000 to $149,999 | 20.1% | 17.9% | 17.4% |
| $150,000 to $199,999 | 17.5% | 9.9% | 9.3% |
| $200,000 or more | 8.6% | 13.1% | 12.6% |


