Compare Indianapolis to…
Indianapolis SnackAbility
Overall SnackAbility
Crime in Indianapolis summary. We use data from the FBI to determine the crime rates in Indianapolis. Key points include:
There were 37,533 total crimes in Indianapolis in the last reporting year.
The overall crime rate per 100,000 people in Indianapolis is 4,213.9 / 100k people.
The violent crime rate per 100,000 people in Indianapolis is 877.9 / 100k people.
The property crime rate per 100,000 people in Indianapolis is 3,336.1 / 100k people.
Overall, crime in Indianapolis is 98.84% above the national average.
Total Crimes
Above National Average
Crime In Indianapolis Comparison Table
| Statistic | Count Raw |
Indianapolis / 100k People |
Indiana / 100k People |
National / 100k People |
|---|---|---|---|---|
| Total Crimes Per 100K | 37,533 | 4,213.9 | 1,691.5 | 2,119.2 |
| Violent Crime | 7,819 | 877.9 | 312.9 | 359.0 |
| Murder | 178 | 20.0 | 5.5 | 5.0 |
| Robbery | 1,275 | 143.1 | 34.5 | 61.0 |
| Aggravated Assault | 5,839 | 655.6 | 239.4 | 256.0 |
| Property Crime | 29,714 | 3,336.1 | 1,378.6 | 1,760.0 |
| Burglary | 4,613 | 517.9 | 176.8 | 229.0 |
| Larceny | 18,456 | 2,072.1 | 988.8 | 1,272.0 |
| Car Theft | 6,645 | 746.1 | 213.0 | 259.0 |
Source: FBI Uniform Crime Reporting (2024)
Cost of living in Indianapolis summary. We use data on the cost of living to determine how expensive it is to live in Indianapolis. Real estate prices drive most of the variance in cost of living around Indiana. Key points include:
The cost of living in Indianapolis is 94 with 100 being average.
The cost of living in Indianapolis is 0.9x lower than the national average.
The median home value in Indianapolis is $229,209.
The median income in Indianapolis is $66,219.
Indianapolis's Overall Cost Of Living
Lower Than The National Average
Cost Of Living In Indianapolis Comparison Table
| Living Expense | Indianapolis | Indiana | National Average |
|---|---|---|---|
| Overall | 94 | 90 | 100 |
| Services | 97 | 97 | 100 |
| Groceries | 97 | 95 | 100 |
| Health | 84 | 72 | 100 |
| Housing | 100 | 98 | 100 |
| Transportation | 99 | 94 | 100 |
| Utilities | 95 | 96 | 100 |
Source: Cost of living index, normalized to US average = 100
Indianapolis, IN Weather
The average high in Indianapolis is 62.1° and the average low is 43.2°.
There are 76.0 days of precipitation each year.
Expect an average of 42.2 inches of precipitation each year with 21.6 inches of snow.
| Stat | Indianapolis |
|---|---|
| Average Annual High | 62.1 |
| Average Annual Low | 43.2 |
| Annual Precipitation Days | 76.0 |
| Average Annual Precipitation | 42.2 |
| Average Annual Snowfall | 21.6 |
Average High
Days of Rain
Source: NOAA climate normals (30-year)
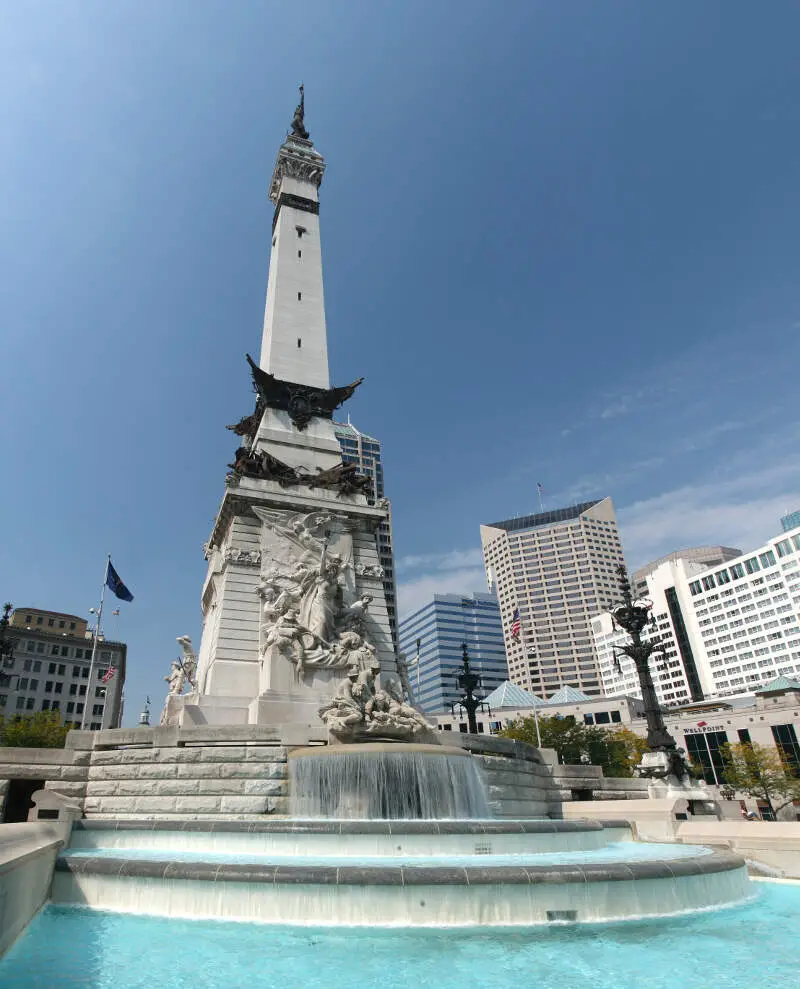
Indianapolis, IN Photos


1 Reviews & Comments About Indianapolis

Indianapolis is a terribly boring city, perhaps the mosy boring major city in the US. The crime is not too bad--it's not an unsafe city except in a few small areas. The schools in the suburbs are good; inside the city they're variable. The housing stock is inexpensive but pretty boring.
Indy has a few good bars and restaurants. Otherwise, it's lame, man. Super lame. Although long-time residents seem to like it. Maybe they don't know any better-
Rankings & Articles For Indianapolis


Locations Around Indianapolis
Map Of Indianapolis, IN
Best Places Around Indianapolis
Zionsville, IN
Population 32,095
Carmel, IN
Population 101,651
Brownsburg, IN
Population 31,215
Noblesville, IN
Population 73,362
Westfield, IN
Population 54,677
New Whiteland, IN
Population 5,704
Lawrence, IN
Population 49,517
Danville, IN
Population 11,714
Cumberland, IN
Population 6,267
Indianapolis Demographics And Statistics
Population over time in Indianapolis
The current population in Indianapolis is 885,860. The population has increased 9.4% from 2010.
| Year | Population | % Change |
|---|---|---|
| 2024 | 885,860 | 0.4% |
| 2023 | 882,043 | 0.0% |
| 2022 | 882,006 | 0.2% |
| 2021 | 880,104 | 1.2% |
| 2020 | 869,387 | 0.6% |
| 2019 | 864,447 | 0.8% |
| 2018 | 857,637 | 0.5% |
| 2017 | 853,431 | 0.8% |
| 2016 | 846,674 | 0.6% |
| 2015 | 841,449 | 0.8% |
| 2014 | 835,097 | 0.8% |
| 2013 | 828,841 | 0.8% |
| 2012 | 822,006 | 0.8% |
| 2011 | 815,607 | 0.7% |
| 2010 | 809,804 | - |
Race / Ethnicity in Indianapolis
See the full breakdown
Indianapolis is:
48.9% White with 433,048 White residents.
27.6% African American with 244,161 African American residents.
0.1% American Indian with 467 American Indian residents.
4.2% Asian with 36,861 Asian residents.
0.0% Hawaiian with 163 Hawaiian residents.
0.6% Other with 5,381 Other residents.
4.9% Two Or More with 43,344 Two Or More residents.
13.8% Hispanic with 122,435 Hispanic residents.
| Race | Indianapolis | IN | USA |
|---|---|---|---|
| White | 48.9% | 75.4% | 57.4% |
| African American | 27.6% | 9.1% | 11.9% |
| American Indian | 0.1% | 0.1% | 0.5% |
| Asian | 4.2% | 2.6% | 5.9% |
| Hawaiian | 0.0% | 0.0% | 0.2% |
| Other | 0.6% | 0.4% | 0.6% |
| Two Or More | 4.9% | 3.8% | 4.3% |
| Hispanic | 13.8% | 8.6% | 19.3% |
Gender in Indianapolis
See the full breakdown
Indianapolis is 51.4% female with 455,457 female residents.
Indianapolis is 48.6% male with 430,402 male residents.
| Gender | Indianapolis | IN | USA |
|---|---|---|---|
| Female | 51.4% | 50.4% | 50.5% |
| Male | 48.6% | 49.6% | 49.5% |
Highest level of educational attainment in Indianapolis for adults over 25
See the full breakdown
6.0% of adults in Indianapolis completed < 9th grade.
7.0% of adults in Indianapolis completed 9-12th grade.
27.0% of adults in Indianapolis completed high school / ged.
19.0% of adults in Indianapolis completed some college.
7.0% of adults in Indianapolis completed associate's degree.
22.0% of adults in Indianapolis completed bachelor's degree.
9.0% of adults in Indianapolis completed master's degree.
2.0% of adults in Indianapolis completed professional degree.
1.0% of adults in Indianapolis completed doctorate degree.
| Education | Indianapolis | IN | USA |
|---|---|---|---|
| < 9th Grade | 6.0% | 3.0% | 4.0% |
| 9-12th Grade | 7.0% | 6.0% | 6.0% |
| High School / GED | 27.0% | 33.0% | 26.0% |
| Some College | 19.0% | 19.0% | 19.0% |
| Associate's Degree | 7.0% | 9.0% | 9.0% |
| Bachelor's Degree | 22.0% | 19.0% | 22.0% |
| Master's Degree | 9.0% | 8.0% | 10.0% |
| Professional Degree | 2.0% | 2.0% | 2.0% |
| Doctorate Degree | 1.0% | 1.0% | 2.0% |
Household Income For Indianapolis, Indiana
See the full breakdown
6.0% of households in Indianapolis earn Less than $10,000.
4.1% of households in Indianapolis earn $10,000 to $14,999.
6.9% of households in Indianapolis earn $15,000 to $24,999.
7.7% of households in Indianapolis earn $25,000 to $34,999.
12.6% of households in Indianapolis earn $35,000 to $49,999.
19.2% of households in Indianapolis earn $50,000 to $74,999.
12.6% of households in Indianapolis earn $75,000 to $99,999.
15.8% of households in Indianapolis earn $100,000 to $149,999.
7.4% of households in Indianapolis earn $150,000 to $199,999.
7.7% of households in Indianapolis earn $200,000 or more.
| Income | Indianapolis | IN | USA |
|---|---|---|---|
| Less than $10,000 | 6.0% | 4.9% | 5.0% |
| $10,000 to $14,999 | 4.1% | 3.4% | 3.4% |
| $15,000 to $24,999 | 6.9% | 6.8% | 6.3% |
| $25,000 to $34,999 | 7.7% | 7.5% | 6.6% |
| $35,000 to $49,999 | 12.6% | 11.8% | 10.1% |
| $50,000 to $74,999 | 19.2% | 17.7% | 15.5% |
| $75,000 to $99,999 | 12.6% | 13.9% | 12.6% |
| $100,000 to $149,999 | 15.8% | 17.5% | 17.5% |
| $150,000 to $199,999 | 7.4% | 8.3% | 9.6% |
| $200,000 or more | 7.7% | 8.2% | 13.4% |
Source: U.S. Census ACS 5-year estimates (2024)


