Marion, IN
Demographics And Statistics
Living In Marion, Indiana Summary
Life in Marion research summary. HomeSnacks has been using Saturday Night Science to research the quality of life in Marion over the past nine years using Census, FBI, Zillow, and other primary data sources. Based on the most recently available data, we found the following about life in Marion:
The population in Marion is 27,384.
The median home value in Marion is $134,014.
The median income in Marion is $43,349.
The cost of living in Marion is 80 which is 0.8x lower than the national average.
The median rent in Marion is $760.
The unemployment rate in Marion is 8.0%.
The poverty rate in Marion is 27.0%.
The average high in Marion is 60.7° and the average low is 41.0°.
Marion SnackAbility
Overall SnackAbility
Marion, IN Crime Report
Crime in Marion summary. We use data from the FBI to determine the crime rates in Marion. Key points include:
There were 340 total crimes in Marion in the last reporting year.
The overall crime rate per 100,000 people in Marion is 1,211.8 / 100k people.
The violent crime rate per 100,000 people in Marion is 106.9 / 100k people.
The property crime rate per 100,000 people in Marion is 1,104.9 / 100k people.
Overall, crime in Marion is -42.82% below the national average.
Total Crimes
Below National Average
Crime In Marion Comparison Table
| Statistic | Count Raw |
Marion / 100k People |
Indiana / 100k People |
National / 100k People |
|---|---|---|---|---|
| Total Crimes Per 100K | 340 | 1,211.8 | 1,691.5 | 2,119.2 |
| Violent Crime | 30 | 106.9 | 312.9 | 359.0 |
| Murder | 0 | 0.0 | 5.5 | 5.0 |
| Robbery | 7 | 24.9 | 34.5 | 61.0 |
| Aggravated Assault | 17 | 60.6 | 239.4 | 256.0 |
| Property Crime | 310 | 1,104.9 | 1,378.6 | 1,760.0 |
| Burglary | 29 | 103.4 | 176.8 | 229.0 |
| Larceny | 250 | 891.0 | 988.8 | 1,272.0 |
| Car Theft | 31 | 110.5 | 213.0 | 259.0 |
Marion, IN Cost Of Living
Cost of living in Marion summary. We use data on the cost of living to determine how expensive it is to live in Marion. Real estate prices drive most of the variance in cost of living around Indiana. Key points include:
The cost of living in Marion is 80 with 100 being average.
The cost of living in Marion is 0.8x lower than the national average.
The median home value in Marion is $134,014.
The median income in Marion is $43,349.
Marion's Overall Cost Of Living
Lower Than The National Average
Cost Of Living In Marion Comparison Table
| Living Expense | Marion | Indiana | National Average | |
|---|---|---|---|---|
| Overall | 80 | 92 | 100 | |
| Services | 87 | 95 | 100 | |
| Groceries | 98 | 97 | 100 | |
| Health | 95 | 94 | 100 | |
| Housing | 48 | 73 | 100 | |
| Transportation | 92 | 94 | 100 | |
| Utilities | 108 | 107 | 100 | |
Marion, IN Weather
The average high in Marion is 60.7° and the average low is 41.0°.
There are 77.5 days of precipitation each year.
Expect an average of 40.6 inches of precipitation each year with 25.1 inches of snow.
| Stat | Marion |
|---|---|
| Average Annual High | 60.7 |
| Average Annual Low | 41.0 |
| Annual Precipitation Days | 77.5 |
| Average Annual Precipitation | 40.6 |
| Average Annual Snowfall | 25.1 |
Average High
Days of Rain
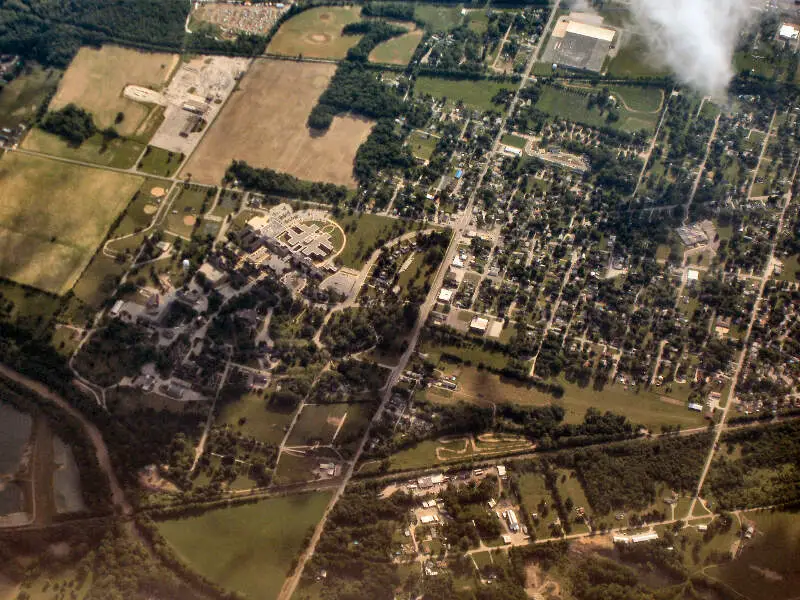
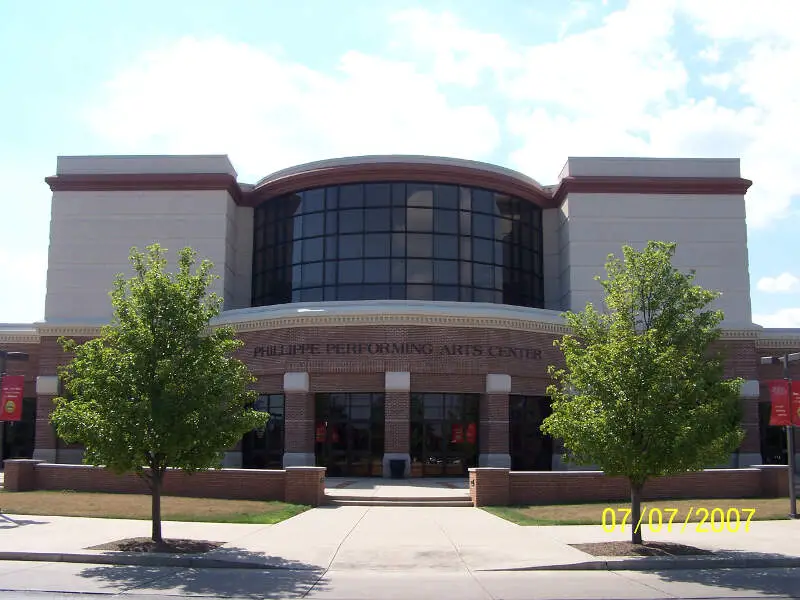
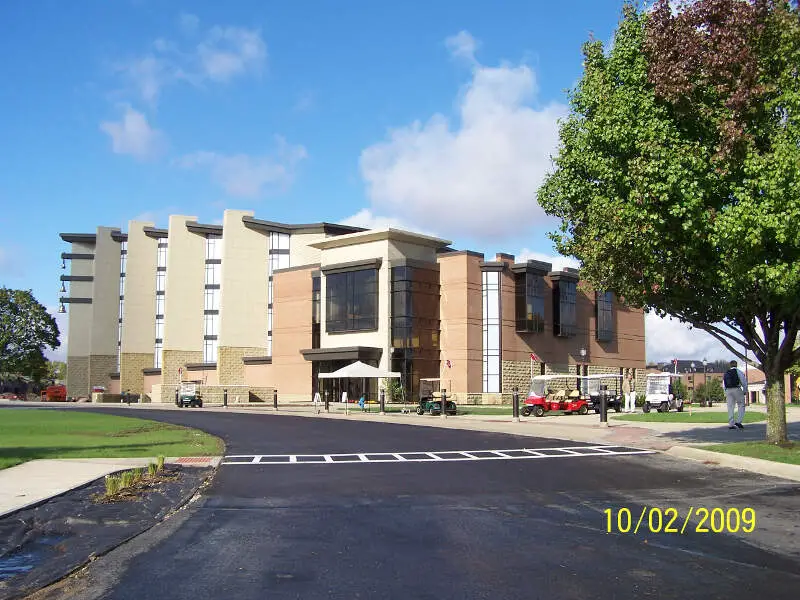
Marion, IN Photos

4 Reviews & Comments About Marion
/5

Kaudi Tarantino - None
I'm from Marion. And.. well...
Klan members and pick ups. Meatheads and snitches. Crooked cops and and a shady system.
Though the narrator on this video made some slightly racist statement as about 40 oz and pitbulls etc
Kinzie Workman - None
I live in Marion. It's changed a lot these last few years! Unemployment rate isn't very high either,and we have some of the best schools for athletes too! Oak hill won the state championship
Derek Martin - None
Marion indiana is honestly bad. I've lived just outside of it my whole life (close enough i commute weekly. Marion is the kind of place that you find fentanyl in the halloween candy.
HomeSnacks User - 2019-05-19 21:54:01.512914
not much crime in my area and its pretty peaceful most of the time.
watch out for the ROADS! THEY S**K HERE IN MARION!!!!
Rankings for Marion in Indiana


Locations Around Marion
Map Of Marion, IN
Best Places Around Marion
Middletown, KY
Population 9,622
Carmel, IN
Population 100,501
Noblesville, IN
Population 71,940
Westfield, IN
Population 51,109
Decatur, IN
Population 9,769
Fort Wayne, IN
Population 266,235
Warsaw, IN
Population 16,592
Frankfort, IN
Population 15,536
Marion Demographics And Statistics
Population over time in Marion
The current population in Marion is 27,384. The population has decreased -10.8% from 2010.
| Year | Population | % Change |
|---|---|---|
| 2023 | 27,384 | -0.5% |
| 2022 | 27,528 | -0.8% |
| 2021 | 27,757 | 0.1% |
| 2020 | 27,730 | -0.8% |
| 2019 | 27,956 | -0.6% |
| 2018 | 28,118 | -1.3% |
| 2017 | 28,490 | -0.7% |
| 2016 | 28,698 | -1.3% |
| 2015 | 29,075 | -1.1% |
| 2014 | 29,403 | -1.4% |
| 2013 | 29,822 | -0.9% |
| 2012 | 30,088 | -0.8% |
| 2011 | 30,335 | -1.2% |
| 2010 | 30,703 | - |
Race / Ethnicity in Marion
Marion is:
74.9% White with 20,501 White residents.
9.8% African American with 2,678 African American residents.
0.4% American Indian with 104 American Indian residents.
1.4% Asian with 372 Asian residents.
0.0% Hawaiian with 0 Hawaiian residents.
0.1% Other with 21 Other residents.
6.3% Two Or More with 1,730 Two Or More residents.
7.2% Hispanic with 1,978 Hispanic residents.
| Race | Marion | IN | USA |
|---|---|---|---|
| White | 74.9% | 76.1% | 58.2% |
| African American | 9.8% | 9.1% | 12.0% |
| American Indian | 0.4% | 0.1% | 0.5% |
| Asian | 1.4% | 2.5% | 5.7% |
| Hawaiian | 0.0% | 0.0% | 0.2% |
| Other | 0.1% | 0.4% | 0.5% |
| Two Or More | 6.3% | 3.4% | 3.9% |
| Hispanic | 7.2% | 8.4% | 19.0% |
Gender in Marion
Marion is 54.0% female with 14,778 female residents.
Marion is 46.0% male with 12,606 male residents.
| Gender | Marion | IN | USA |
|---|---|---|---|
| Female | 54.0% | 50.4% | 50.5% |
| Male | 46.0% | 49.6% | 49.5% |
Highest level of educational attainment in Marion for adults over 25
7.0% of adults in Marion completed < 9th grade.
9.0% of adults in Marion completed 9-12th grade.
39.0% of adults in Marion completed high school / ged.
22.0% of adults in Marion completed some college.
6.0% of adults in Marion completed associate's degree.
10.0% of adults in Marion completed bachelor's degree.
6.0% of adults in Marion completed master's degree.
0.0% of adults in Marion completed professional degree.
1.0% of adults in Marion completed doctorate degree.
| Education | Marion | IN | USA |
|---|---|---|---|
| < 9th Grade | 7.0% | 3.0% | 5.0% |
| 9-12th Grade | 9.0% | 6.0% | 6.0% |
| High School / GED | 39.0% | 33.0% | 26.0% |
| Some College | 22.0% | 20.0% | 19.0% |
| Associate's Degree | 6.0% | 9.0% | 9.0% |
| Bachelor's Degree | 10.0% | 18.0% | 21.0% |
| Master's Degree | 6.0% | 8.0% | 10.0% |
| Professional Degree | 0.0% | 2.0% | 2.0% |
| Doctorate Degree | 1.0% | 1.0% | 2.0% |
Household Income For Marion, Indiana
9.8% of households in Marion earn Less than $10,000.
6.8% of households in Marion earn $10,000 to $14,999.
9.8% of households in Marion earn $15,000 to $24,999.
12.3% of households in Marion earn $25,000 to $34,999.
18.4% of households in Marion earn $35,000 to $49,999.
18.0% of households in Marion earn $50,000 to $74,999.
10.8% of households in Marion earn $75,000 to $99,999.
9.3% of households in Marion earn $100,000 to $149,999.
2.6% of households in Marion earn $150,000 to $199,999.
2.1% of households in Marion earn $200,000 or more.
| Income | Marion | IN | USA |
|---|---|---|---|
| Less than $10,000 | 9.8% | 4.9% | 4.9% |
| $10,000 to $14,999 | 6.8% | 3.5% | 3.6% |
| $15,000 to $24,999 | 9.8% | 7.1% | 6.6% |
| $25,000 to $34,999 | 12.3% | 7.8% | 6.8% |
| $35,000 to $49,999 | 18.4% | 12.2% | 10.4% |
| $50,000 to $74,999 | 18.0% | 17.9% | 15.7% |
| $75,000 to $99,999 | 10.8% | 13.9% | 12.7% |
| $100,000 to $149,999 | 9.3% | 17.2% | 17.4% |
| $150,000 to $199,999 | 2.6% | 7.9% | 9.3% |
| $200,000 or more | 2.1% | 7.6% | 12.6% |


