Cynthiana SnackAbility
Overall SnackAbility
Crime in Cynthiana summary. We use data from the FBI to determine the crime rates in Cynthiana. Key points include:
There were 92 total crimes in Cynthiana in the last reporting year.
The overall crime rate per 100,000 people in Cynthiana is 1,393.9 / 100k people.
The violent crime rate per 100,000 people in Cynthiana is 151.5 / 100k people.
The property crime rate per 100,000 people in Cynthiana is 1,242.4 / 100k people.
Overall, crime in Cynthiana is -34.22% below the national average.
Total Crimes
Below National Average
Crime In Cynthiana Comparison Table
| Statistic | Count Raw |
Cynthiana / 100k People |
Kentucky / 100k People |
National / 100k People |
|---|---|---|---|---|
| Total Crimes Per 100K | 92 | 1,393.9 | 1,563.0 | 2,119.2 |
| Violent Crime | 10 | 151.5 | 213.1 | 359.0 |
| Murder | 0 | 0.0 | 6.1 | 5.0 |
| Robbery | 1 | 15.2 | 35.1 | 61.0 |
| Aggravated Assault | 8 | 121.2 | 139.5 | 256.0 |
| Property Crime | 82 | 1,242.4 | 1,349.9 | 1,760.0 |
| Burglary | 6 | 90.9 | 193.6 | 229.0 |
| Larceny | 68 | 1,030.3 | 930.2 | 1,272.0 |
| Car Theft | 8 | 121.2 | 226.2 | 259.0 |
Source: FBI Uniform Crime Reporting (2024)
Cost of living in Cynthiana summary. We use data on the cost of living to determine how expensive it is to live in Cynthiana. Real estate prices drive most of the variance in cost of living around Kentucky. Key points include:
The cost of living in Cynthiana is 86 with 100 being average.
The cost of living in Cynthiana is 0.9x lower than the national average.
The median home value in Cynthiana is $236,039.
The median income in Cynthiana is $54,647.
Cynthiana's Overall Cost Of Living
Lower Than The National Average
Cost Of Living In Cynthiana Comparison Table
| Living Expense | Cynthiana | Kentucky | National Average |
|---|---|---|---|
| Overall | 86 | 89 | 100 |
| Services | 99 | 100 | 100 |
| Groceries | 100 | 98 | 100 |
| Health | 64 | 68 | 100 |
| Housing | 92 | 98 | 100 |
| Transportation | 95 | 95 | 100 |
| Utilities | 96 | 96 | 100 |
Source: Cost of living index, normalized to US average = 100
Cynthiana, KY Weather
The average high in Cynthiana is 65.9° and the average low is 43.5°.
There are 69.5 days of precipitation each year.
Expect an average of 43.6 inches of precipitation each year with 9.7 inches of snow.
| Stat | Cynthiana |
|---|---|
| Average Annual High | 65.9 |
| Average Annual Low | 43.5 |
| Annual Precipitation Days | 69.5 |
| Average Annual Precipitation | 43.6 |
| Average Annual Snowfall | 9.7 |
Average High
Days of Rain
Source: NOAA climate normals (30-year)
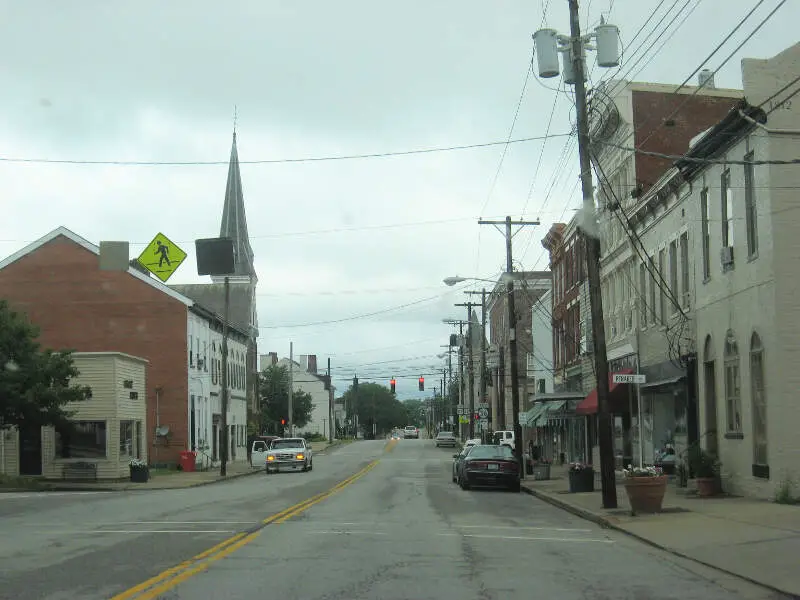
Cynthiana, KY Photos

Rankings & Articles For Cynthiana


Locations Around Cynthiana
Map Of Cynthiana, KY
Best Places Around Cynthiana
Dry Run, OH
Population 7,687
Forestville, OH
Population 10,831
Withamsville, OH
Population 7,429
Villa Hills, KY
Population 7,480
Edgewood, KY
Population 8,447
Cold Spring, KY
Population 6,341
Union, KY
Population 7,642
Crestview Hills, KY
Population 3,284
Cynthiana Demographics And Statistics
Population over time in Cynthiana
The current population in Cynthiana is 6,458. The population has increased 0.0% from 2010.
| Year | Population | % Change |
|---|---|---|
| 2024 | 6,458 | 0.7% |
| 2023 | 6,412 | 0.9% |
| 2022 | 6,355 | 1.0% |
| 2021 | 6,291 | 0.3% |
| 2020 | 6,270 | -0.7% |
| 2019 | 6,312 | -0.6% |
| 2018 | 6,348 | 0.3% |
| 2017 | 6,328 | -0.8% |
| 2016 | 6,376 | -0.1% |
| 2015 | 6,380 | -0.1% |
| 2014 | 6,388 | -0.2% |
| 2013 | 6,402 | -0.1% |
| 2012 | 6,406 | -0.5% |
| 2011 | 6,436 | -0.3% |
| 2010 | 6,457 | - |
Race / Ethnicity in Cynthiana
See the full breakdown
Cynthiana is:
90.1% White with 5,818 White residents.
2.9% African American with 185 African American residents.
0.1% American Indian with 9 American Indian residents.
0.0% Asian with 0 Asian residents.
0.0% Hawaiian with 0 Hawaiian residents.
0.0% Other with 0 Other residents.
4.8% Two Or More with 309 Two Or More residents.
2.1% Hispanic with 137 Hispanic residents.
| Race | Cynthiana | KY | USA |
|---|---|---|---|
| White | 90.1% | 81.5% | 57.4% |
| African American | 2.9% | 7.6% | 11.9% |
| American Indian | 0.1% | 0.1% | 0.5% |
| Asian | 0.0% | 1.6% | 5.9% |
| Hawaiian | 0.0% | 0.1% | 0.2% |
| Other | 0.0% | 0.3% | 0.6% |
| Two Or More | 4.8% | 3.9% | 4.3% |
| Hispanic | 2.1% | 5.0% | 19.3% |
Gender in Cynthiana
See the full breakdown
Cynthiana is 56.7% female with 3,663 female residents.
Cynthiana is 43.3% male with 2,794 male residents.
| Gender | Cynthiana | KY | USA |
|---|---|---|---|
| Female | 56.7% | 50.5% | 50.5% |
| Male | 43.3% | 49.5% | 49.5% |
Highest level of educational attainment in Cynthiana for adults over 25
See the full breakdown
2.0% of adults in Cynthiana completed < 9th grade.
6.0% of adults in Cynthiana completed 9-12th grade.
51.0% of adults in Cynthiana completed high school / ged.
20.0% of adults in Cynthiana completed some college.
6.0% of adults in Cynthiana completed associate's degree.
8.0% of adults in Cynthiana completed bachelor's degree.
7.0% of adults in Cynthiana completed master's degree.
0.0% of adults in Cynthiana completed professional degree.
0.0% of adults in Cynthiana completed doctorate degree.
| Education | Cynthiana | KY | USA |
|---|---|---|---|
| < 9th Grade | 2.0% | 4.0% | 4.0% |
| 9-12th Grade | 6.0% | 7.0% | 6.0% |
| High School / GED | 51.0% | 33.0% | 26.0% |
| Some College | 20.0% | 20.0% | 19.0% |
| Associate's Degree | 6.0% | 9.0% | 9.0% |
| Bachelor's Degree | 8.0% | 16.0% | 22.0% |
| Master's Degree | 7.0% | 8.0% | 10.0% |
| Professional Degree | 0.0% | 2.0% | 2.0% |
| Doctorate Degree | 0.0% | 1.0% | 2.0% |
Household Income For Cynthiana, Kentucky
See the full breakdown
5.4% of households in Cynthiana earn Less than $10,000.
12.9% of households in Cynthiana earn $10,000 to $14,999.
7.8% of households in Cynthiana earn $15,000 to $24,999.
8.4% of households in Cynthiana earn $25,000 to $34,999.
9.5% of households in Cynthiana earn $35,000 to $49,999.
26.6% of households in Cynthiana earn $50,000 to $74,999.
6.6% of households in Cynthiana earn $75,000 to $99,999.
17.0% of households in Cynthiana earn $100,000 to $149,999.
3.9% of households in Cynthiana earn $150,000 to $199,999.
1.9% of households in Cynthiana earn $200,000 or more.
| Income | Cynthiana | KY | USA |
|---|---|---|---|
| Less than $10,000 | 5.4% | 6.1% | 5.0% |
| $10,000 to $14,999 | 12.9% | 5.2% | 3.4% |
| $15,000 to $24,999 | 7.8% | 8.3% | 6.3% |
| $25,000 to $34,999 | 8.4% | 8.3% | 6.6% |
| $35,000 to $49,999 | 9.5% | 12.1% | 10.1% |
| $50,000 to $74,999 | 26.6% | 17.1% | 15.5% |
| $75,000 to $99,999 | 6.6% | 12.8% | 12.6% |
| $100,000 to $149,999 | 17.0% | 15.9% | 17.5% |
| $150,000 to $199,999 | 3.9% | 7.1% | 9.6% |
| $200,000 or more | 1.9% | 7.2% | 13.4% |
Source: U.S. Census ACS 5-year estimates (2024)


