Elkton SnackAbility
Overall SnackAbility
Crime in Elkton summary. We use data from the FBI to determine the crime rates in Elkton. Key points include:
There were 1,011 total crimes in Elkton in the last reporting year.
The overall crime rate per 100,000 people in Elkton is 6,312.0 / 100k people.
The violent crime rate per 100,000 people in Elkton is 1,080.1 / 100k people.
The property crime rate per 100,000 people in Elkton is 5,231.9 / 100k people.
Overall, crime in Elkton is 197.85% above the national average.
Total Crimes
Above National Average
Crime In Elkton Comparison Table
| Statistic | Count Raw |
Elkton / 100k People |
Maryland / 100k People |
National / 100k People |
|---|---|---|---|---|
| Total Crimes Per 100K | 1,011 | 6,312.0 | 2,470.0 | 2,119.2 |
| Violent Crime | 173 | 1,080.1 | 420.4 | 359.0 |
| Murder | 2 | 12.5 | 7.2 | 5.0 |
| Robbery | 39 | 243.5 | 123.2 | 61.0 |
| Aggravated Assault | 112 | 699.3 | 257.0 | 256.0 |
| Property Crime | 838 | 5,231.9 | 2,049.6 | 1,760.0 |
| Burglary | 101 | 630.6 | 190.0 | 229.0 |
| Larceny | 582 | 3,633.6 | 1,446.8 | 1,272.0 |
| Car Theft | 155 | 967.7 | 412.8 | 259.0 |
Source: FBI Uniform Crime Reporting (2024)
Cost of living in Elkton summary. We use data on the cost of living to determine how expensive it is to live in Elkton. Real estate prices drive most of the variance in cost of living around Maryland. Key points include:
The cost of living in Elkton is 103 with 100 being average.
The cost of living in Elkton is 1.0x higher than the national average.
The median home value in Elkton is $367,248.
The median income in Elkton is $58,640.
Elkton's Overall Cost Of Living
Higher Than The National Average
Cost Of Living In Elkton Comparison Table
| Living Expense | Elkton | Maryland | National Average |
|---|---|---|---|
| Overall | 103 | 121 | 100 |
| Services | 100 | 104 | 100 |
| Groceries | 103 | 107 | 100 |
| Health | 117 | 152 | 100 |
| Housing | 102 | 109 | 100 |
| Transportation | 98 | 108 | 100 |
| Utilities | 100 | 109 | 100 |
Source: Cost of living index, normalized to US average = 100
Elkton, MD Weather
The average high in Elkton is 65.3° and the average low is 44.5°.
There are 75.6 days of precipitation each year.
Expect an average of 45.5 inches of precipitation each year with 13.1 inches of snow.
| Stat | Elkton |
|---|---|
| Average Annual High | 65.3 |
| Average Annual Low | 44.5 |
| Annual Precipitation Days | 75.6 |
| Average Annual Precipitation | 45.5 |
| Average Annual Snowfall | 13.1 |
Average High
Days of Rain
Source: NOAA climate normals (30-year)
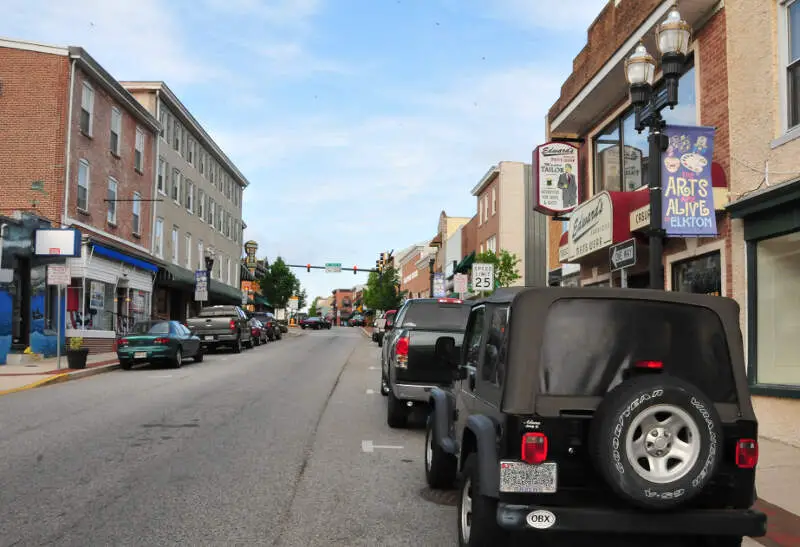
Elkton, MD Photos
2 Reviews & Comments About Elkton

I live in Elkton and its bad, but if you mind your own business you'll be fine. Grew up on booth street. Lots of drugs and prostitution. Really its a mixed bag.
i live in elkton its the worst theres so many predators and crackheads running around wawa at 2 am lol
Rankings & Articles For Elkton


Locations Around Elkton
Map Of Elkton, MD
Best Places Around Elkton
Kennett Square, PA
Population 6,243
Pennsville, NJ
Population 12,233
Oxford, PA
Population 5,825
Havre de Grace, MD
Population 14,994
Pike Creek, DE
Population 7,129
Hockessin, DE
Population 13,439
North Star, DE
Population 7,834
Glasgow, DE
Population 15,546
Pike Creek Valley, DE
Population 12,431
Elkton Demographics And Statistics
Population over time in Elkton
The current population in Elkton is 15,910. The population has increased 5.9% from 2010.
| Year | Population | % Change |
|---|---|---|
| 2024 | 15,910 | 0.3% |
| 2023 | 15,867 | 0.2% |
| 2022 | 15,830 | 0.7% |
| 2021 | 15,724 | 0.5% |
| 2020 | 15,653 | 0.1% |
| 2019 | 15,644 | -0.2% |
| 2018 | 15,675 | 0.2% |
| 2017 | 15,651 | -0.2% |
| 2016 | 15,687 | -0.2% |
| 2015 | 15,718 | 0.3% |
| 2014 | 15,673 | 0.6% |
| 2013 | 15,578 | 1.2% |
| 2012 | 15,393 | 1.0% |
| 2011 | 15,240 | 1.4% |
| 2010 | 15,029 | - |
Race / Ethnicity in Elkton
See the full breakdown
Elkton is:
61.4% White with 9,766 White residents.
16.6% African American with 2,635 African American residents.
0.0% American Indian with 2 American Indian residents.
2.6% Asian with 416 Asian residents.
0.0% Hawaiian with 3 Hawaiian residents.
3.0% Other with 471 Other residents.
8.6% Two Or More with 1,372 Two Or More residents.
7.8% Hispanic with 1,245 Hispanic residents.
| Race | Elkton | MD | USA |
|---|---|---|---|
| White | 61.4% | 46.6% | 57.4% |
| African American | 16.6% | 28.9% | 11.9% |
| American Indian | 0.0% | 0.1% | 0.5% |
| Asian | 2.6% | 6.5% | 5.9% |
| Hawaiian | 0.0% | 0.0% | 0.2% |
| Other | 3.0% | 0.7% | 0.6% |
| Two Or More | 8.6% | 4.6% | 4.3% |
| Hispanic | 7.8% | 12.5% | 19.3% |
Gender in Elkton
See the full breakdown
Elkton is 51.7% female with 8,227 female residents.
Elkton is 48.3% male with 7,683 male residents.
| Gender | Elkton | MD | USA |
|---|---|---|---|
| Female | 51.7% | 51.3% | 50.5% |
| Male | 48.3% | 48.7% | 49.5% |
Highest level of educational attainment in Elkton for adults over 25
See the full breakdown
4.0% of adults in Elkton completed < 9th grade.
7.0% of adults in Elkton completed 9-12th grade.
40.0% of adults in Elkton completed high school / ged.
19.0% of adults in Elkton completed some college.
9.0% of adults in Elkton completed associate's degree.
14.0% of adults in Elkton completed bachelor's degree.
6.0% of adults in Elkton completed master's degree.
0.0% of adults in Elkton completed professional degree.
1.0% of adults in Elkton completed doctorate degree.
| Education | Elkton | MD | USA |
|---|---|---|---|
| < 9th Grade | 4.0% | 4.0% | 4.0% |
| 9-12th Grade | 7.0% | 5.0% | 6.0% |
| High School / GED | 40.0% | 23.0% | 26.0% |
| Some College | 19.0% | 17.0% | 19.0% |
| Associate's Degree | 9.0% | 7.0% | 9.0% |
| Bachelor's Degree | 14.0% | 23.0% | 22.0% |
| Master's Degree | 6.0% | 15.0% | 10.0% |
| Professional Degree | 0.0% | 3.0% | 2.0% |
| Doctorate Degree | 1.0% | 3.0% | 2.0% |
Household Income For Elkton, Maryland
See the full breakdown
3.6% of households in Elkton earn Less than $10,000.
2.3% of households in Elkton earn $10,000 to $14,999.
9.3% of households in Elkton earn $15,000 to $24,999.
12.0% of households in Elkton earn $25,000 to $34,999.
14.1% of households in Elkton earn $35,000 to $49,999.
14.2% of households in Elkton earn $50,000 to $74,999.
14.8% of households in Elkton earn $75,000 to $99,999.
11.9% of households in Elkton earn $100,000 to $149,999.
9.7% of households in Elkton earn $150,000 to $199,999.
8.1% of households in Elkton earn $200,000 or more.
| Income | Elkton | MD | USA |
|---|---|---|---|
| Less than $10,000 | 3.6% | 4.4% | 5.0% |
| $10,000 to $14,999 | 2.3% | 2.4% | 3.4% |
| $15,000 to $24,999 | 9.3% | 4.3% | 6.3% |
| $25,000 to $34,999 | 12.0% | 4.9% | 6.6% |
| $35,000 to $49,999 | 14.1% | 7.5% | 10.1% |
| $50,000 to $74,999 | 14.2% | 12.8% | 15.5% |
| $75,000 to $99,999 | 14.8% | 11.9% | 12.6% |
| $100,000 to $149,999 | 11.9% | 18.9% | 17.5% |
| $150,000 to $199,999 | 9.7% | 12.5% | 9.6% |
| $200,000 or more | 8.1% | 20.3% | 13.4% |
Source: U.S. Census ACS 5-year estimates (2024)


