New Baltimore SnackAbility
Overall SnackAbility
Crime in New Baltimore summary. We use data from the FBI to determine the crime rates in New Baltimore. Key points include:
There were 53 total crimes in New Baltimore in the last reporting year.
The overall crime rate per 100,000 people in New Baltimore is 443.1 / 100k people.
The violent crime rate per 100,000 people in New Baltimore is 41.8 / 100k people.
The property crime rate per 100,000 people in New Baltimore is 401.3 / 100k people.
Overall, crime in New Baltimore is -79.09% below the national average.
Total Crimes
Below National Average
Crime In New Baltimore Comparison Table
| Statistic | Count Raw |
New Baltimore / 100k People |
Michigan / 100k People |
National / 100k People |
|---|---|---|---|---|
| Total Crimes Per 100K | 53 | 443.1 | 1,813.2 | 2,119.2 |
| Violent Crime | 5 | 41.8 | 434.3 | 359.0 |
| Murder | 0 | 0.0 | 5.2 | 5.0 |
| Robbery | 0 | 0.0 | 31.3 | 61.0 |
| Aggravated Assault | 2 | 16.7 | 341.3 | 256.0 |
| Property Crime | 48 | 401.3 | 1,378.9 | 1,760.0 |
| Burglary | 2 | 16.7 | 184.2 | 229.0 |
| Larceny | 42 | 351.1 | 963.6 | 1,272.0 |
| Car Theft | 4 | 33.4 | 231.0 | 259.0 |
Source: FBI Uniform Crime Reporting (2024)
Cost of living in New Baltimore summary. We use data on the cost of living to determine how expensive it is to live in New Baltimore. Real estate prices drive most of the variance in cost of living around Michigan. Key points include:
The cost of living in New Baltimore is 103 with 100 being average.
The cost of living in New Baltimore is 1.0x higher than the national average.
The median home value in New Baltimore is $354,732.
The median income in New Baltimore is $106,033.
New Baltimore's Overall Cost Of Living
Higher Than The National Average
Cost Of Living In New Baltimore Comparison Table
| Living Expense | New Baltimore | Michigan | National Average |
|---|---|---|---|
| Overall | 103 | 91 | 100 |
| Services | 96 | 97 | 100 |
| Groceries | 96 | 98 | 100 |
| Health | 116 | 75 | 100 |
| Housing | 99 | 98 | 100 |
| Transportation | 102 | 101 | 100 |
| Utilities | 98 | 98 | 100 |
Source: Cost of living index, normalized to US average = 100
New Baltimore, MI Weather
The average high in New Baltimore is 58.5° and the average low is 40.3°.
There are 71.5 days of precipitation each year.
Expect an average of 33.2 inches of precipitation each year with 31.9 inches of snow.
| Stat | New Baltimore |
|---|---|
| Average Annual High | 58.5 |
| Average Annual Low | 40.3 |
| Annual Precipitation Days | 71.5 |
| Average Annual Precipitation | 33.2 |
| Average Annual Snowfall | 31.9 |
Average High
Days of Rain
Source: NOAA climate normals (30-year)
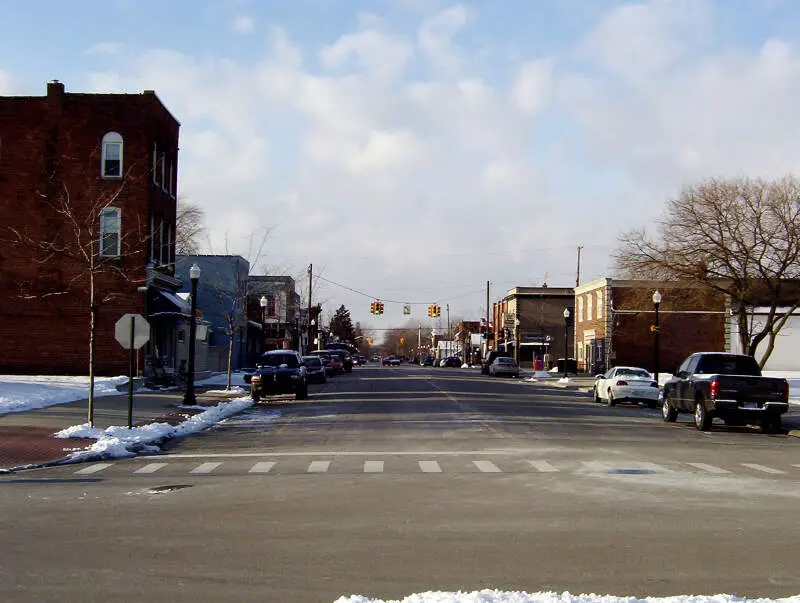
New Baltimore, MI Photos

Rankings & Articles For New Baltimore


Locations Around New Baltimore
Map Of New Baltimore, MI
Best Places Around New Baltimore
Rochester, MI
Population 12,934
Grosse Pointe Woods, MI
Population 16,094
Sterling Heights, MI
Population 133,573
Fraser, MI
Population 14,583
St. Clair Shores, MI
Population 58,140
Richmond, MI
Population 5,855
Eastpointe, MI
Population 33,982
St. Clair, MI
Population 5,585
Mount Clemens, MI
Population 15,511
Harper Woods, MI
Population 15,116
New Baltimore Demographics And Statistics
Population over time in New Baltimore
The current population in New Baltimore is 12,072. The population has increased 6.6% from 2010.
| Year | Population | % Change |
|---|---|---|
| 2024 | 12,072 | 0.1% |
| 2023 | 12,060 | -0.4% |
| 2022 | 12,104 | -0.4% |
| 2021 | 12,147 | -1.5% |
| 2020 | 12,333 | -0.2% |
| 2019 | 12,358 | -0.1% |
| 2018 | 12,365 | 0.4% |
| 2017 | 12,315 | 0.4% |
| 2016 | 12,266 | 0.4% |
| 2015 | 12,212 | 0.6% |
| 2014 | 12,144 | 0.8% |
| 2013 | 12,044 | 1.3% |
| 2012 | 11,884 | 2.1% |
| 2011 | 11,645 | 2.8% |
| 2010 | 11,327 | - |
Race / Ethnicity in New Baltimore
See the full breakdown
New Baltimore is:
89.7% White with 10,830 White residents.
1.2% African American with 144 African American residents.
0.0% American Indian with 0 American Indian residents.
0.5% Asian with 65 Asian residents.
0.0% Hawaiian with 0 Hawaiian residents.
0.0% Other with 0 Other residents.
4.9% Two Or More with 594 Two Or More residents.
3.6% Hispanic with 439 Hispanic residents.
| Race | New Baltimore | MI | USA |
|---|---|---|---|
| White | 89.7% | 72.4% | 57.4% |
| African American | 1.2% | 13.1% | 11.9% |
| American Indian | 0.0% | 0.3% | 0.5% |
| Asian | 0.5% | 3.4% | 5.9% |
| Hawaiian | 0.0% | 0.0% | 0.2% |
| Other | 0.0% | 0.5% | 0.6% |
| Two Or More | 4.9% | 4.5% | 4.3% |
| Hispanic | 3.6% | 5.9% | 19.3% |
Gender in New Baltimore
See the full breakdown
New Baltimore is 52.3% female with 6,310 female residents.
New Baltimore is 47.7% male with 5,762 male residents.
| Gender | New Baltimore | MI | USA |
|---|---|---|---|
| Female | 52.3% | 50.4% | 50.5% |
| Male | 47.7% | 49.6% | 49.5% |
Highest level of educational attainment in New Baltimore for adults over 25
See the full breakdown
1.0% of adults in New Baltimore completed < 9th grade.
6.0% of adults in New Baltimore completed 9-12th grade.
23.0% of adults in New Baltimore completed high school / ged.
29.0% of adults in New Baltimore completed some college.
10.0% of adults in New Baltimore completed associate's degree.
20.0% of adults in New Baltimore completed bachelor's degree.
8.0% of adults in New Baltimore completed master's degree.
2.0% of adults in New Baltimore completed professional degree.
1.0% of adults in New Baltimore completed doctorate degree.
| Education | New Baltimore | MI | USA |
|---|---|---|---|
| < 9th Grade | 1.0% | 3.0% | 4.0% |
| 9-12th Grade | 6.0% | 5.0% | 6.0% |
| High School / GED | 23.0% | 28.0% | 26.0% |
| Some College | 29.0% | 22.0% | 19.0% |
| Associate's Degree | 10.0% | 10.0% | 9.0% |
| Bachelor's Degree | 20.0% | 20.0% | 22.0% |
| Master's Degree | 8.0% | 9.0% | 10.0% |
| Professional Degree | 2.0% | 2.0% | 2.0% |
| Doctorate Degree | 1.0% | 1.0% | 2.0% |
Household Income For New Baltimore, Michigan
See the full breakdown
3.0% of households in New Baltimore earn Less than $10,000.
1.5% of households in New Baltimore earn $10,000 to $14,999.
4.7% of households in New Baltimore earn $15,000 to $24,999.
7.5% of households in New Baltimore earn $25,000 to $34,999.
8.1% of households in New Baltimore earn $35,000 to $49,999.
11.0% of households in New Baltimore earn $50,000 to $74,999.
11.8% of households in New Baltimore earn $75,000 to $99,999.
22.2% of households in New Baltimore earn $100,000 to $149,999.
16.0% of households in New Baltimore earn $150,000 to $199,999.
14.1% of households in New Baltimore earn $200,000 or more.
| Income | New Baltimore | MI | USA |
|---|---|---|---|
| Less than $10,000 | 3.0% | 5.2% | 5.0% |
| $10,000 to $14,999 | 1.5% | 3.8% | 3.4% |
| $15,000 to $24,999 | 4.7% | 6.8% | 6.3% |
| $25,000 to $34,999 | 7.5% | 7.3% | 6.6% |
| $35,000 to $49,999 | 8.1% | 11.4% | 10.1% |
| $50,000 to $74,999 | 11.0% | 16.8% | 15.5% |
| $75,000 to $99,999 | 11.8% | 13.2% | 12.6% |
| $100,000 to $149,999 | 22.2% | 17.3% | 17.5% |
| $150,000 to $199,999 | 16.0% | 8.6% | 9.6% |
| $200,000 or more | 14.1% | 9.5% | 13.4% |
Source: U.S. Census ACS 5-year estimates (2024)


