Albertville, MN
Demographics And Statistics
Living In Albertville, Minnesota Summary
Life in Albertville research summary. HomeSnacks has been using Saturday Night Science to research the quality of life in Albertville over the past nine years using Census, FBI, Zillow, and other primary data sources. Based on the most recently available data, we found the following about life in Albertville:
The population in Albertville is 8,066.
The median home value in Albertville is $375,909.
The median income in Albertville is $126,307.
The cost of living in Albertville is 103 which is 1.0x higher than the national average.
The median rent in Albertville is $1,385.
The poverty rate in Albertville is 0.6%.
The average high in Albertville is 54.5° and the average low is 34.5°.
Table Of Contents
Albertville SnackAbility
Overall SnackAbility
Albertville, MN Cost Of Living
Cost of living in Albertville summary. We use data on the cost of living to determine how expensive it is to live in Albertville. Real estate prices drive most of the variance in cost of living around Minnesota. Key points include:
The cost of living in Albertville is 103 with 100 being average.
The cost of living in Albertville is 1.0x higher than the national average.
The median home value in Albertville is $375,909.
The median income in Albertville is $126,307.
Albertville's Overall Cost Of Living
Higher Than The National Average
Cost Of Living In Albertville Comparison Table
| Living Expense | Albertville | Minnesota | National Average | |
|---|---|---|---|---|
| Overall | 103 | 97 | 100 | |
| Services | 95 | 101 | 100 | |
| Groceries | 97 | 99 | 100 | |
| Health | 101 | 110 | 100 | |
| Housing | 128 | 100 | 100 | |
| Transportation | 99 | 95 | 100 | |
| Utilities | 96 | 94 | 100 | |
Albertville, MN Weather
The average high in Albertville is 54.5° and the average low is 34.5°.
There are 56.1 days of precipitation each year.
Expect an average of 30.9 inches of precipitation each year with 41.8 inches of snow.
| Stat | Albertville |
|---|---|
| Average Annual High | 54.5 |
| Average Annual Low | 34.5 |
| Annual Precipitation Days | 56.1 |
| Average Annual Precipitation | 30.9 |
| Average Annual Snowfall | 41.8 |
Average High
Days of Rain
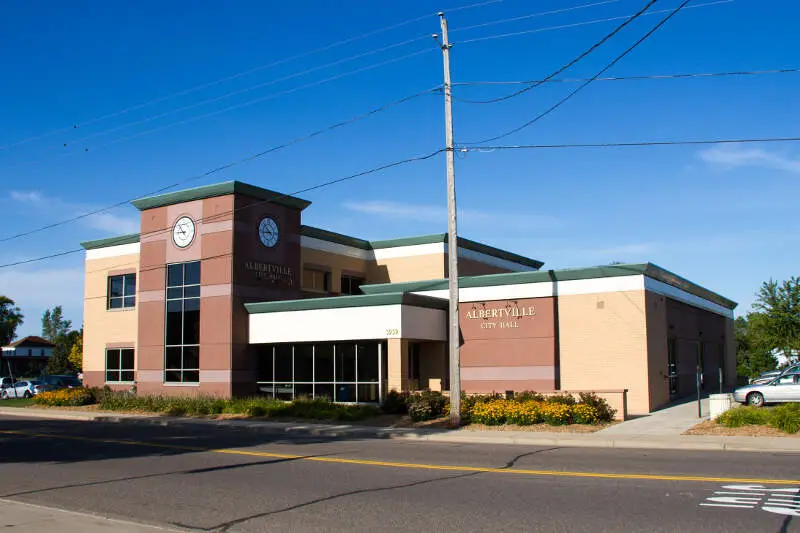
Albertville, MN Photos
Rankings for Albertville in Minnesota


Locations Around Albertville
Map Of Albertville, MN
Best Places Around Albertville
Maple Grove, MN
Population 70,539
Plymouth, MN
Population 79,526
Rogers, MN
Population 13,405
Champlin, MN
Population 23,450
Corcoran, MN
Population 6,854
Orono, MN
Population 8,205
Andover, MN
Population 32,825
St. Michael, MN
Population 19,267
New Hope, MN
Population 21,402
Oak Grove, MN
Population 9,031
Albertville Demographics And Statistics
Population over time in Albertville
The current population in Albertville is 8,066. The population has increased 23.2% from 2010.
| Year | Population | % Change |
|---|---|---|
| 2023 | 8,066 | 2.3% |
| 2022 | 7,883 | 1.2% |
| 2021 | 7,792 | 4.1% |
| 2020 | 7,483 | 0.6% |
| 2019 | 7,436 | 0.8% |
| 2018 | 7,377 | 1.0% |
| 2017 | 7,303 | 0.2% |
| 2016 | 7,286 | 0.8% |
| 2015 | 7,226 | 0.9% |
| 2014 | 7,159 | 0.8% |
| 2013 | 7,100 | 1.9% |
| 2012 | 6,969 | 2.6% |
| 2011 | 6,790 | 3.7% |
| 2010 | 6,548 | - |
Race / Ethnicity in Albertville
Albertville is:
88.5% White with 7,138 White residents.
0.6% African American with 49 African American residents.
0.0% American Indian with 0 American Indian residents.
1.0% Asian with 83 Asian residents.
0.0% Hawaiian with 0 Hawaiian residents.
2.4% Other with 191 Other residents.
6.4% Two Or More with 517 Two Or More residents.
1.1% Hispanic with 88 Hispanic residents.
| Race | Albertville | MN | USA |
|---|---|---|---|
| White | 88.5% | 76.7% | 58.2% |
| African American | 0.6% | 6.7% | 12.0% |
| American Indian | 0.0% | 0.7% | 0.5% |
| Asian | 1.0% | 5.0% | 5.7% |
| Hawaiian | 0.0% | 0.0% | 0.2% |
| Other | 2.4% | 0.4% | 0.5% |
| Two Or More | 6.4% | 4.1% | 3.9% |
| Hispanic | 1.1% | 6.2% | 19.0% |
Gender in Albertville
Albertville is 51.4% female with 4,145 female residents.
Albertville is 48.6% male with 3,921 male residents.
| Gender | Albertville | MN | USA |
|---|---|---|---|
| Female | 51.4% | 49.9% | 50.5% |
| Male | 48.6% | 50.1% | 49.5% |
Highest level of educational attainment in Albertville for adults over 25
2.0% of adults in Albertville completed < 9th grade.
2.0% of adults in Albertville completed 9-12th grade.
20.0% of adults in Albertville completed high school / ged.
23.0% of adults in Albertville completed some college.
13.0% of adults in Albertville completed associate's degree.
27.0% of adults in Albertville completed bachelor's degree.
13.0% of adults in Albertville completed master's degree.
0.0% of adults in Albertville completed professional degree.
0.0% of adults in Albertville completed doctorate degree.
| Education | Albertville | MN | USA |
|---|---|---|---|
| < 9th Grade | 2.0% | 2.0% | 5.0% |
| 9-12th Grade | 2.0% | 3.0% | 6.0% |
| High School / GED | 20.0% | 24.0% | 26.0% |
| Some College | 23.0% | 20.0% | 19.0% |
| Associate's Degree | 13.0% | 12.0% | 9.0% |
| Bachelor's Degree | 27.0% | 25.0% | 21.0% |
| Master's Degree | 13.0% | 10.0% | 10.0% |
| Professional Degree | 0.0% | 2.0% | 2.0% |
| Doctorate Degree | 0.0% | 2.0% | 2.0% |
Household Income For Albertville, Minnesota
1.1% of households in Albertville earn Less than $10,000.
0.4% of households in Albertville earn $10,000 to $14,999.
0.9% of households in Albertville earn $15,000 to $24,999.
0.4% of households in Albertville earn $25,000 to $34,999.
5.7% of households in Albertville earn $35,000 to $49,999.
12.8% of households in Albertville earn $50,000 to $74,999.
20.1% of households in Albertville earn $75,000 to $99,999.
14.7% of households in Albertville earn $100,000 to $149,999.
24.8% of households in Albertville earn $150,000 to $199,999.
19.1% of households in Albertville earn $200,000 or more.
| Income | Albertville | MN | USA |
|---|---|---|---|
| Less than $10,000 | 1.1% | 3.5% | 4.9% |
| $10,000 to $14,999 | 0.4% | 2.8% | 3.6% |
| $15,000 to $24,999 | 0.9% | 5.4% | 6.6% |
| $25,000 to $34,999 | 0.4% | 5.8% | 6.8% |
| $35,000 to $49,999 | 5.7% | 9.6% | 10.4% |
| $50,000 to $74,999 | 12.8% | 15.7% | 15.7% |
| $75,000 to $99,999 | 20.1% | 13.5% | 12.7% |
| $100,000 to $149,999 | 14.7% | 19.7% | 17.4% |
| $150,000 to $199,999 | 24.8% | 10.9% | 9.3% |
| $200,000 or more | 19.1% | 13.1% | 12.6% |


