St. Michael SnackAbility
Overall SnackAbility
Cost of living in St. Michael summary. We use data on the cost of living to determine how expensive it is to live in St. Michael. Real estate prices drive most of the variance in cost of living around Minnesota. Key points include:
The cost of living in St. Michael is 112 with 100 being average.
The cost of living in St. Michael is 1.1x higher than the national average.
The median home value in St. Michael is $426,651.
The median income in St. Michael is $131,274.
St. Michael's Overall Cost Of Living
Higher Than The National Average
Cost Of Living In St. Michael Comparison Table
| Living Expense | St. Michael | Minnesota | National Average |
|---|---|---|---|
| Overall | 112 | 101 | 100 |
| Services | 99 | 101 | 100 |
| Groceries | 99 | 99 | 100 |
| Health | 147 | 99 | 100 |
| Housing | 103 | 101 | 100 |
| Transportation | 101 | 103 | 100 |
| Utilities | 98 | 101 | 100 |
Source: Cost of living index, normalized to US average = 100
St. Michael, MN Weather
The average high in St. Michael is 54.5° and the average low is 34.8°.
There are 56.1 days of precipitation each year.
Expect an average of 30.9 inches of precipitation each year with 42.2 inches of snow.
| Stat | St. Michael |
|---|---|
| Average Annual High | 54.5 |
| Average Annual Low | 34.8 |
| Annual Precipitation Days | 56.1 |
| Average Annual Precipitation | 30.9 |
| Average Annual Snowfall | 42.2 |
Average High
Days of Rain
Source: NOAA climate normals (30-year)
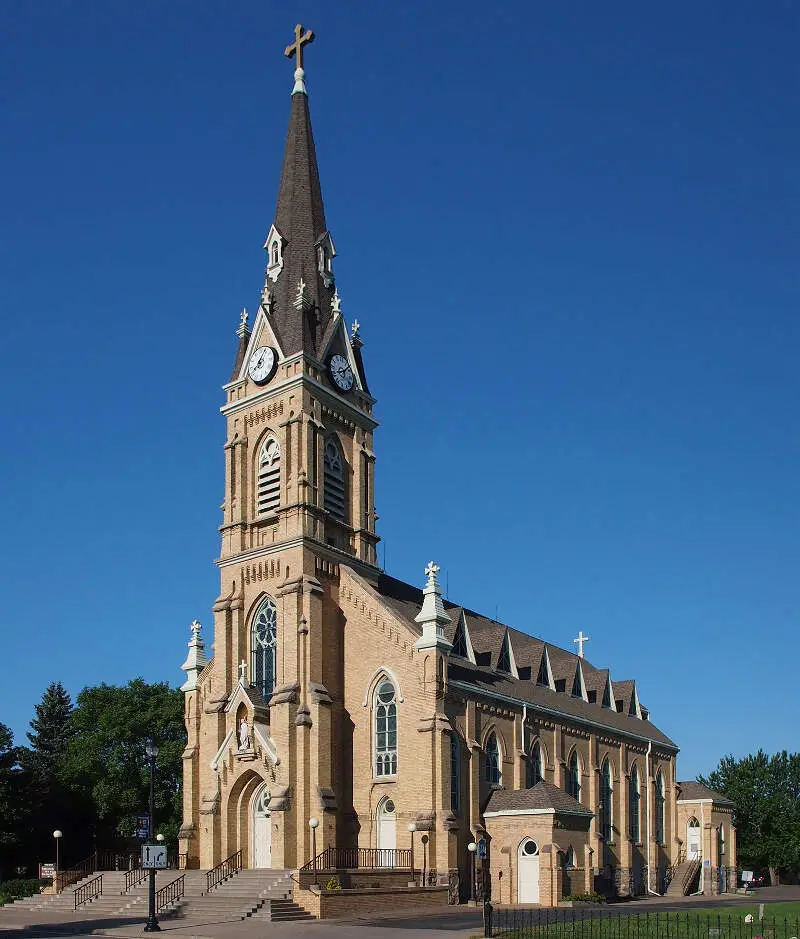
St. Michael, MN Photos
Rankings & Articles For St. Michael


Locations Around St. Michael
Map Of St. Michael, MN
Best Places Around St. Michael
Maple Grove, MN
Population 71,173
Plymouth, MN
Population 79,220
Rogers, MN
Population 13,685
Minnetrista, MN
Population 8,708
Champlin, MN
Population 23,294
Corcoran, MN
Population 7,302
Mound, MN
Population 9,107
Orono, MN
Population 8,195
Andover, MN
Population 33,035
Crystal, MN
Population 22,476
St. Michael Demographics And Statistics
Population over time in St. Michael
The current population in St. Michael is 20,010. The population has increased 30.1% from 2010.
| Year | Population | % Change |
|---|---|---|
| 2024 | 20,010 | 3.9% |
| 2023 | 19,267 | 3.3% |
| 2022 | 18,648 | 2.8% |
| 2021 | 18,148 | 1.5% |
| 2020 | 17,871 | 1.6% |
| 2019 | 17,586 | 1.5% |
| 2018 | 17,328 | 1.2% |
| 2017 | 17,128 | 0.5% |
| 2016 | 17,045 | 0.8% |
| 2015 | 16,911 | 0.9% |
| 2014 | 16,767 | 1.3% |
| 2013 | 16,557 | 1.8% |
| 2012 | 16,263 | 2.3% |
| 2011 | 15,896 | 3.3% |
| 2010 | 15,384 | - |
Race / Ethnicity in St. Michael
See the full breakdown
St. Michael is:
85.5% White with 17,109 White residents.
5.1% African American with 1,028 African American residents.
0.3% American Indian with 52 American Indian residents.
2.7% Asian with 546 Asian residents.
0.0% Hawaiian with 0 Hawaiian residents.
0.1% Other with 14 Other residents.
3.7% Two Or More with 739 Two Or More residents.
2.6% Hispanic with 522 Hispanic residents.
| Race | St. Michael | MN | USA |
|---|---|---|---|
| White | 85.5% | 75.9% | 57.4% |
| African American | 5.1% | 6.9% | 11.9% |
| American Indian | 0.3% | 0.7% | 0.5% |
| Asian | 2.7% | 5.1% | 5.9% |
| Hawaiian | 0.0% | 0.0% | 0.2% |
| Other | 0.1% | 0.5% | 0.6% |
| Two Or More | 3.7% | 4.5% | 4.3% |
| Hispanic | 2.6% | 6.4% | 19.3% |
Gender in St. Michael
See the full breakdown
St. Michael is 45.8% female with 9,164 female residents.
St. Michael is 54.2% male with 10,846 male residents.
| Gender | St. Michael | MN | USA |
|---|---|---|---|
| Female | 45.8% | 49.9% | 50.5% |
| Male | 54.2% | 50.1% | 49.5% |
Highest level of educational attainment in St. Michael for adults over 25
See the full breakdown
0.0% of adults in St. Michael completed < 9th grade.
1.0% of adults in St. Michael completed 9-12th grade.
19.0% of adults in St. Michael completed high school / ged.
19.0% of adults in St. Michael completed some college.
16.0% of adults in St. Michael completed associate's degree.
32.0% of adults in St. Michael completed bachelor's degree.
9.0% of adults in St. Michael completed master's degree.
2.0% of adults in St. Michael completed professional degree.
2.0% of adults in St. Michael completed doctorate degree.
| Education | St. Michael | MN | USA |
|---|---|---|---|
| < 9th Grade | 0.0% | 3.0% | 4.0% |
| 9-12th Grade | 1.0% | 3.0% | 6.0% |
| High School / GED | 19.0% | 23.0% | 26.0% |
| Some College | 19.0% | 19.0% | 19.0% |
| Associate's Degree | 16.0% | 12.0% | 9.0% |
| Bachelor's Degree | 32.0% | 26.0% | 22.0% |
| Master's Degree | 9.0% | 10.0% | 10.0% |
| Professional Degree | 2.0% | 2.0% | 2.0% |
| Doctorate Degree | 2.0% | 2.0% | 2.0% |
Household Income For St. Michael, Minnesota
See the full breakdown
2.8% of households in St. Michael earn Less than $10,000.
1.4% of households in St. Michael earn $10,000 to $14,999.
1.4% of households in St. Michael earn $15,000 to $24,999.
1.0% of households in St. Michael earn $25,000 to $34,999.
4.3% of households in St. Michael earn $35,000 to $49,999.
9.5% of households in St. Michael earn $50,000 to $74,999.
10.9% of households in St. Michael earn $75,000 to $99,999.
29.1% of households in St. Michael earn $100,000 to $149,999.
19.2% of households in St. Michael earn $150,000 to $199,999.
20.5% of households in St. Michael earn $200,000 or more.
| Income | St. Michael | MN | USA |
|---|---|---|---|
| Less than $10,000 | 2.8% | 3.8% | 5.0% |
| $10,000 to $14,999 | 1.4% | 2.7% | 3.4% |
| $15,000 to $24,999 | 1.4% | 5.2% | 6.3% |
| $25,000 to $34,999 | 1.0% | 5.6% | 6.6% |
| $35,000 to $49,999 | 4.3% | 9.3% | 10.1% |
| $50,000 to $74,999 | 9.5% | 15.6% | 15.5% |
| $75,000 to $99,999 | 10.9% | 13.2% | 12.6% |
| $100,000 to $149,999 | 29.1% | 19.6% | 17.5% |
| $150,000 to $199,999 | 19.2% | 11.2% | 9.6% |
| $200,000 or more | 20.5% | 13.8% | 13.4% |
Source: U.S. Census ACS 5-year estimates (2024)


