Bloomington SnackAbility
Overall SnackAbility
Crime in Bloomington summary. We use data from the FBI to determine the crime rates in Bloomington. Key points include:
There were 3,673 total crimes in Bloomington in the last reporting year.
The overall crime rate per 100,000 people in Bloomington is 4,231.9 / 100k people.
The violent crime rate per 100,000 people in Bloomington is 307.6 / 100k people.
The property crime rate per 100,000 people in Bloomington is 3,924.3 / 100k people.
Overall, crime in Bloomington is 99.69% above the national average.
Total Crimes
Above National Average
Crime In Bloomington Comparison Table
| Statistic | Count Raw |
Bloomington / 100k People |
Minnesota / 100k People |
National / 100k People |
|---|---|---|---|---|
| Total Crimes Per 100K | 3,673 | 4,231.9 | 1,862.9 | 2,119.2 |
| Violent Crime | 267 | 307.6 | 256.6 | 359.0 |
| Murder | 3 | 3.5 | 2.9 | 5.0 |
| Robbery | 45 | 51.8 | 48.9 | 61.0 |
| Aggravated Assault | 166 | 191.3 | 168.0 | 256.0 |
| Property Crime | 3,406 | 3,924.3 | 1,606.3 | 1,760.0 |
| Burglary | 166 | 191.3 | 184.7 | 229.0 |
| Larceny | 2,982 | 3,435.8 | 1,208.5 | 1,272.0 |
| Car Theft | 258 | 297.3 | 213.1 | 259.0 |
Source: FBI Uniform Crime Reporting (2024)
Cost of living in Bloomington summary. We use data on the cost of living to determine how expensive it is to live in Bloomington. Real estate prices drive most of the variance in cost of living around Minnesota. Key points include:
The cost of living in Bloomington is 112 with 100 being average.
The cost of living in Bloomington is 1.1x higher than the national average.
The median home value in Bloomington is $361,589.
The median income in Bloomington is $93,211.
Bloomington's Overall Cost Of Living
Higher Than The National Average
Cost Of Living In Bloomington Comparison Table
| Living Expense | Bloomington | Minnesota | National Average |
|---|---|---|---|
| Overall | 112 | 101 | 100 |
| Services | 98 | 101 | 100 |
| Groceries | 100 | 99 | 100 |
| Health | 139 | 99 | 100 |
| Housing | 102 | 101 | 100 |
| Transportation | 101 | 103 | 100 |
| Utilities | 101 | 101 | 100 |
Source: Cost of living index, normalized to US average = 100
Bloomington, MN Weather
The average high in Bloomington is 55.4° and the average low is 37.0°.
There are 61.8 days of precipitation each year.
Expect an average of 32.1 inches of precipitation each year with 52.0 inches of snow.
| Stat | Bloomington |
|---|---|
| Average Annual High | 55.4 |
| Average Annual Low | 37.0 |
| Annual Precipitation Days | 61.8 |
| Average Annual Precipitation | 32.1 |
| Average Annual Snowfall | 52.0 |
Average High
Days of Rain
Source: NOAA climate normals (30-year)
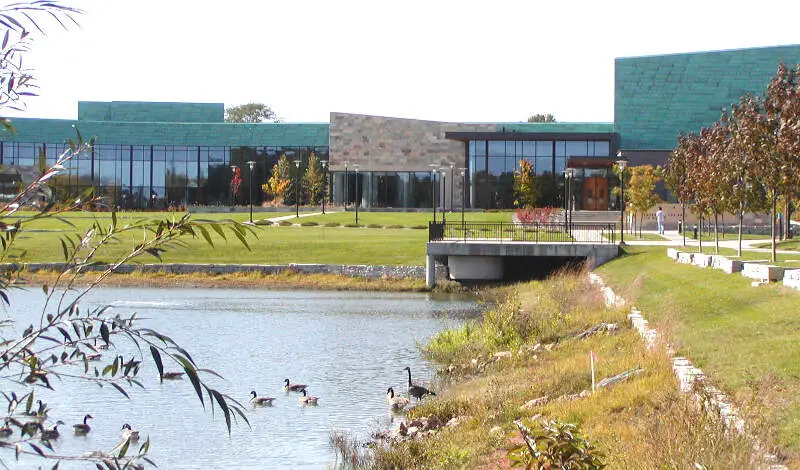
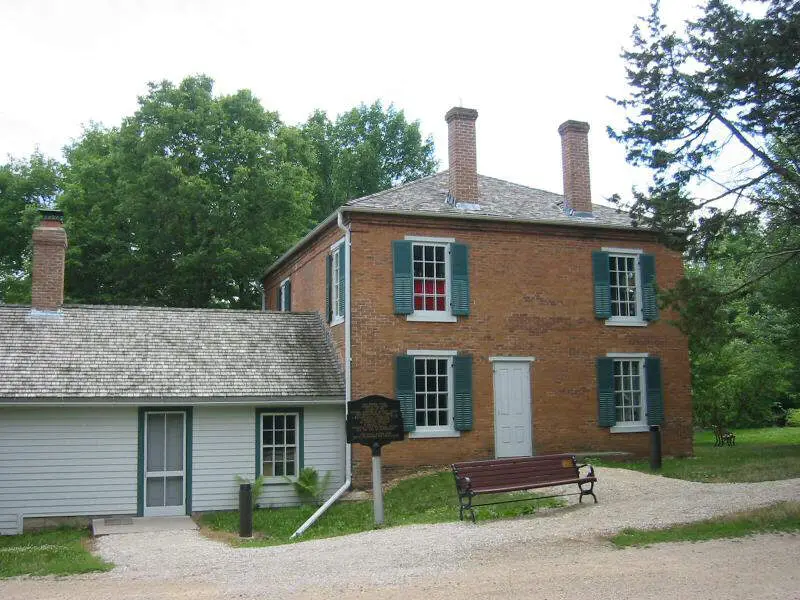
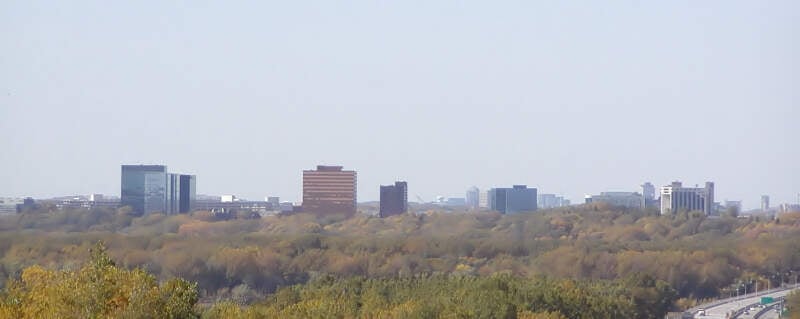
Bloomington, MN Photos


Rankings & Articles For Bloomington


Locations Around Bloomington
Map Of Bloomington, MN
Best Places Around Bloomington
Edina, MN
Population 53,262
Shoreview, MN
Population 26,714
Plymouth, MN
Population 79,220
Eden Prairie, MN
Population 63,051
Shorewood, MN
Population 7,647
Woodbury, MN
Population 78,305
Minnetonka, MN
Population 53,064
Lakeville, MN
Population 74,354
Mendota Heights, MN
Population 11,612
Apple Valley, MN
Population 55,679
Bloomington Demographics And Statistics
Population over time in Bloomington
The current population in Bloomington is 88,665. The population has increased 7.3% from 2010.
| Year | Population | % Change |
|---|---|---|
| 2024 | 88,665 | -0.2% |
| 2023 | 88,838 | -0.5% |
| 2022 | 89,244 | -0.2% |
| 2021 | 89,436 | 4.9% |
| 2020 | 85,226 | -0.1% |
| 2019 | 85,332 | -0.1% |
| 2018 | 85,394 | -0.0% |
| 2017 | 85,417 | 0.4% |
| 2016 | 85,080 | -0.9% |
| 2015 | 85,826 | 0.8% |
| 2014 | 85,136 | 0.8% |
| 2013 | 84,451 | 0.9% |
| 2012 | 83,658 | 0.8% |
| 2011 | 82,962 | 0.4% |
| 2010 | 82,621 | - |
Race / Ethnicity in Bloomington
See the full breakdown
Bloomington is:
65.0% White with 57,598 White residents.
12.0% African American with 10,645 African American residents.
0.3% American Indian with 290 American Indian residents.
5.1% Asian with 4,564 Asian residents.
0.0% Hawaiian with 0 Hawaiian residents.
1.5% Other with 1,299 Other residents.
4.9% Two Or More with 4,365 Two Or More residents.
11.2% Hispanic with 9,904 Hispanic residents.
| Race | Bloomington | MN | USA |
|---|---|---|---|
| White | 65.0% | 75.9% | 57.4% |
| African American | 12.0% | 6.9% | 11.9% |
| American Indian | 0.3% | 0.7% | 0.5% |
| Asian | 5.1% | 5.1% | 5.9% |
| Hawaiian | 0.0% | 0.0% | 0.2% |
| Other | 1.5% | 0.5% | 0.6% |
| Two Or More | 4.9% | 4.5% | 4.3% |
| Hispanic | 11.2% | 6.4% | 19.3% |
Gender in Bloomington
See the full breakdown
Bloomington is 51.7% female with 45,863 female residents.
Bloomington is 48.3% male with 42,802 male residents.
| Gender | Bloomington | MN | USA |
|---|---|---|---|
| Female | 51.7% | 49.9% | 50.5% |
| Male | 48.3% | 50.1% | 49.5% |
Highest level of educational attainment in Bloomington for adults over 25
See the full breakdown
4.0% of adults in Bloomington completed < 9th grade.
3.0% of adults in Bloomington completed 9-12th grade.
19.0% of adults in Bloomington completed high school / ged.
18.0% of adults in Bloomington completed some college.
11.0% of adults in Bloomington completed associate's degree.
32.0% of adults in Bloomington completed bachelor's degree.
10.0% of adults in Bloomington completed master's degree.
2.0% of adults in Bloomington completed professional degree.
1.0% of adults in Bloomington completed doctorate degree.
| Education | Bloomington | MN | USA |
|---|---|---|---|
| < 9th Grade | 4.0% | 3.0% | 4.0% |
| 9-12th Grade | 3.0% | 3.0% | 6.0% |
| High School / GED | 19.0% | 23.0% | 26.0% |
| Some College | 18.0% | 19.0% | 19.0% |
| Associate's Degree | 11.0% | 12.0% | 9.0% |
| Bachelor's Degree | 32.0% | 26.0% | 22.0% |
| Master's Degree | 10.0% | 10.0% | 10.0% |
| Professional Degree | 2.0% | 2.0% | 2.0% |
| Doctorate Degree | 1.0% | 2.0% | 2.0% |
Household Income For Bloomington, Minnesota
See the full breakdown
3.4% of households in Bloomington earn Less than $10,000.
1.6% of households in Bloomington earn $10,000 to $14,999.
4.9% of households in Bloomington earn $15,000 to $24,999.
5.3% of households in Bloomington earn $25,000 to $34,999.
9.1% of households in Bloomington earn $35,000 to $49,999.
15.5% of households in Bloomington earn $50,000 to $74,999.
14.0% of households in Bloomington earn $75,000 to $99,999.
18.7% of households in Bloomington earn $100,000 to $149,999.
13.3% of households in Bloomington earn $150,000 to $199,999.
14.1% of households in Bloomington earn $200,000 or more.
| Income | Bloomington | MN | USA |
|---|---|---|---|
| Less than $10,000 | 3.4% | 3.8% | 5.0% |
| $10,000 to $14,999 | 1.6% | 2.7% | 3.4% |
| $15,000 to $24,999 | 4.9% | 5.2% | 6.3% |
| $25,000 to $34,999 | 5.3% | 5.6% | 6.6% |
| $35,000 to $49,999 | 9.1% | 9.3% | 10.1% |
| $50,000 to $74,999 | 15.5% | 15.6% | 15.5% |
| $75,000 to $99,999 | 14.0% | 13.2% | 12.6% |
| $100,000 to $149,999 | 18.7% | 19.6% | 17.5% |
| $150,000 to $199,999 | 13.3% | 11.2% | 9.6% |
| $200,000 or more | 14.1% | 13.8% | 13.4% |
Source: U.S. Census ACS 5-year estimates (2024)


