Glendale SnackAbility
Overall SnackAbility
Crime in Glendale summary. We use data from the FBI to determine the crime rates in Glendale. Key points include:
There were 23 total crimes in Glendale in the last reporting year.
The overall crime rate per 100,000 people in Glendale is 382.6 / 100k people.
The violent crime rate per 100,000 people in Glendale is 16.6 / 100k people.
The property crime rate per 100,000 people in Glendale is 366.0 / 100k people.
Overall, crime in Glendale is -81.94% below the national average.
Total Crimes
Below National Average
Crime In Glendale Comparison Table
| Statistic | Count Raw |
Glendale / 100k People |
Missouri / 100k People |
National / 100k People |
|---|---|---|---|---|
| Total Crimes Per 100K | 23 | 382.6 | 2,403.3 | 2,119.2 |
| Violent Crime | 1 | 16.6 | 462.0 | 359.0 |
| Murder | 0 | 0.0 | 7.8 | 5.0 |
| Robbery | 0 | 0.0 | 51.5 | 61.0 |
| Aggravated Assault | 0 | 0.0 | 357.5 | 256.0 |
| Property Crime | 22 | 366.0 | 1,941.2 | 1,760.0 |
| Burglary | 0 | 0.0 | 236.3 | 229.0 |
| Larceny | 19 | 316.1 | 1,306.5 | 1,272.0 |
| Car Theft | 3 | 49.9 | 398.4 | 259.0 |
Source: FBI Uniform Crime Reporting (2024)
Cost of living in Glendale summary. We use data on the cost of living to determine how expensive it is to live in Glendale. Real estate prices drive most of the variance in cost of living around Missouri. Key points include:
The cost of living in Glendale is 131 with 100 being average.
The cost of living in Glendale is 1.3x higher than the national average.
The median home value in Glendale is $565,844.
The median income in Glendale is $170,700.
Glendale's Overall Cost Of Living
Higher Than The National Average
Cost Of Living In Glendale Comparison Table
| Living Expense | Glendale | Missouri | National Average |
|---|---|---|---|
| Overall | 131 | 90 | 100 |
| Services | 98 | 97 | 100 |
| Groceries | 99 | 98 | 100 |
| Health | 208 | 76 | 100 |
| Housing | 93 | 95 | 100 |
| Transportation | 94 | 94 | 100 |
| Utilities | 100 | 96 | 100 |
Source: Cost of living index, normalized to US average = 100
Glendale, MO Weather
The average high in Glendale is 65.9° and the average low is 46.8°.
There are 71.9 days of precipitation each year.
Expect an average of 42.6 inches of precipitation each year with 14.3 inches of snow.
| Stat | Glendale |
|---|---|
| Average Annual High | 65.9 |
| Average Annual Low | 46.8 |
| Annual Precipitation Days | 71.9 |
| Average Annual Precipitation | 42.6 |
| Average Annual Snowfall | 14.3 |
Average High
Days of Rain
Source: NOAA climate normals (30-year)
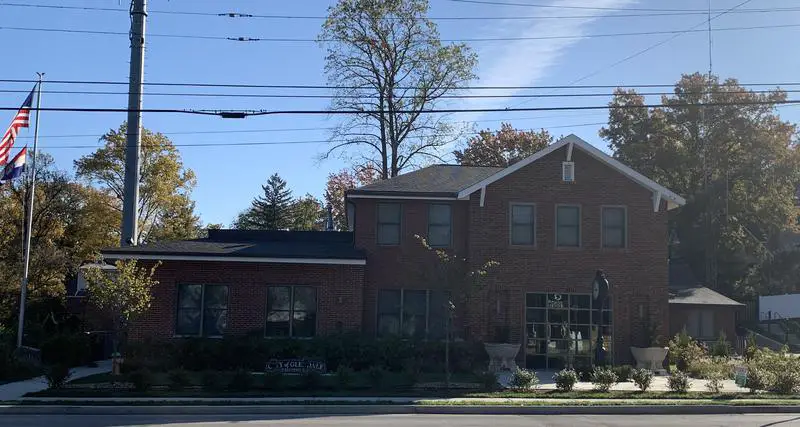
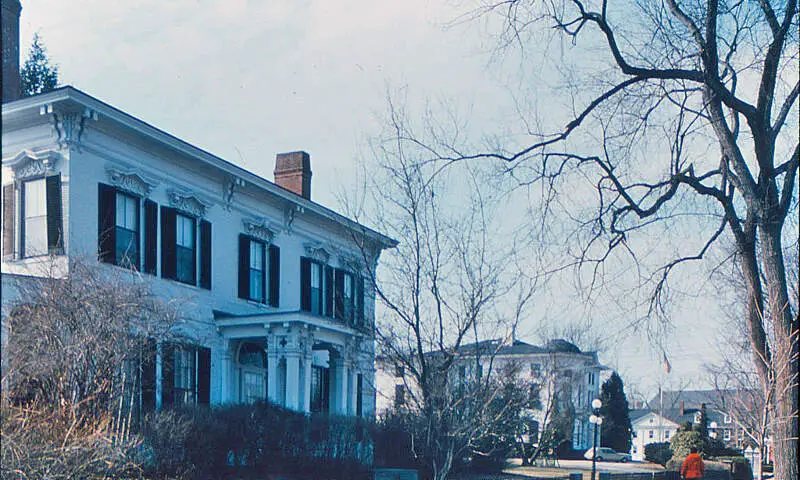
Glendale, MO Photos
Rankings & Articles For Glendale


Locations Around Glendale
Map Of Glendale, MO
Best Places Around Glendale
Columbia, IL
Population 11,127
Pontoon Beach, IL
Population 6,025
Wildwood, MO
Population 35,133
Ballwin, MO
Population 31,279
Chesterfield, MO
Population 49,574
Town and Country, MO
Population 11,607
Kirkwood, MO
Population 29,363
Weldon Spring, MO
Population 5,310
Old Jamestown, MO
Population 20,651
Webster Groves, MO
Population 23,712
Glendale Demographics And Statistics
Population over time in Glendale
The current population in Glendale is 6,114. The population has increased 4.0% from 2010.
| Year | Population | % Change |
|---|---|---|
| 2024 | 6,114 | 0.0% |
| 2023 | 6,111 | -0.3% |
| 2022 | 6,131 | -0.2% |
| 2021 | 6,143 | 4.5% |
| 2020 | 5,881 | -0.2% |
| 2019 | 5,891 | 0.1% |
| 2018 | 5,888 | -0.5% |
| 2017 | 5,919 | 0.0% |
| 2016 | 5,917 | -0.2% |
| 2015 | 5,928 | 0.0% |
| 2014 | 5,926 | 0.2% |
| 2013 | 5,913 | 0.0% |
| 2012 | 5,911 | 0.2% |
| 2011 | 5,897 | 0.3% |
| 2010 | 5,880 | - |
Race / Ethnicity in Glendale
See the full breakdown
Glendale is:
92.5% White with 5,658 White residents.
0.0% African American with 0 African American residents.
0.0% American Indian with 0 American Indian residents.
1.1% Asian with 69 Asian residents.
0.0% Hawaiian with 0 Hawaiian residents.
0.0% Other with 0 Other residents.
4.1% Two Or More with 249 Two Or More residents.
2.3% Hispanic with 138 Hispanic residents.
| Race | Glendale | MO | USA |
|---|---|---|---|
| White | 92.5% | 76.3% | 57.4% |
| African American | 0.0% | 10.9% | 11.9% |
| American Indian | 0.0% | 0.2% | 0.5% |
| Asian | 1.1% | 2.1% | 5.9% |
| Hawaiian | 0.0% | 0.1% | 0.2% |
| Other | 0.0% | 0.4% | 0.6% |
| Two Or More | 4.1% | 4.8% | 4.3% |
| Hispanic | 2.3% | 5.2% | 19.3% |
Gender in Glendale
See the full breakdown
Glendale is 55.2% female with 3,377 female residents.
Glendale is 44.8% male with 2,737 male residents.
| Gender | Glendale | MO | USA |
|---|---|---|---|
| Female | 55.2% | 50.7% | 50.5% |
| Male | 44.8% | 49.3% | 49.5% |
Highest level of educational attainment in Glendale for adults over 25
See the full breakdown
0.0% of adults in Glendale completed < 9th grade.
0.0% of adults in Glendale completed 9-12th grade.
2.0% of adults in Glendale completed high school / ged.
7.0% of adults in Glendale completed some college.
1.0% of adults in Glendale completed associate's degree.
42.0% of adults in Glendale completed bachelor's degree.
35.0% of adults in Glendale completed master's degree.
10.0% of adults in Glendale completed professional degree.
3.0% of adults in Glendale completed doctorate degree.
| Education | Glendale | MO | USA |
|---|---|---|---|
| < 9th Grade | 0.0% | 4.0% | 4.0% |
| 9-12th Grade | 0.0% | 5.0% | 6.0% |
| High School / GED | 2.0% | 30.0% | 26.0% |
| Some College | 7.0% | 21.0% | 19.0% |
| Associate's Degree | 1.0% | 8.0% | 9.0% |
| Bachelor's Degree | 42.0% | 20.0% | 22.0% |
| Master's Degree | 35.0% | 9.0% | 10.0% |
| Professional Degree | 10.0% | 2.0% | 2.0% |
| Doctorate Degree | 3.0% | 1.0% | 2.0% |
Household Income For Glendale, Missouri
See the full breakdown
0.9% of households in Glendale earn Less than $10,000.
0.5% of households in Glendale earn $10,000 to $14,999.
0.8% of households in Glendale earn $15,000 to $24,999.
0.7% of households in Glendale earn $25,000 to $34,999.
1.5% of households in Glendale earn $35,000 to $49,999.
5.5% of households in Glendale earn $50,000 to $74,999.
20.6% of households in Glendale earn $75,000 to $99,999.
13.4% of households in Glendale earn $100,000 to $149,999.
13.4% of households in Glendale earn $150,000 to $199,999.
42.7% of households in Glendale earn $200,000 or more.
| Income | Glendale | MO | USA |
|---|---|---|---|
| Less than $10,000 | 0.9% | 4.9% | 5.0% |
| $10,000 to $14,999 | 0.5% | 3.8% | 3.4% |
| $15,000 to $24,999 | 0.8% | 7.1% | 6.3% |
| $25,000 to $34,999 | 0.7% | 7.8% | 6.6% |
| $35,000 to $49,999 | 1.5% | 11.9% | 10.1% |
| $50,000 to $74,999 | 5.5% | 17.4% | 15.5% |
| $75,000 to $99,999 | 20.6% | 13.2% | 12.6% |
| $100,000 to $149,999 | 13.4% | 17.1% | 17.5% |
| $150,000 to $199,999 | 13.4% | 8.2% | 9.6% |
| $200,000 or more | 42.7% | 8.7% | 13.4% |
Source: U.S. Census ACS 5-year estimates (2024)


