Jennings SnackAbility
Overall SnackAbility
Cost of living in Jennings summary. We use data on the cost of living to determine how expensive it is to live in Jennings. Real estate prices drive most of the variance in cost of living around Missouri. Key points include:
The cost of living in Jennings is 84 with 100 being average.
The cost of living in Jennings is 0.8x lower than the national average.
The median home value in Jennings is $73,368.
The median income in Jennings is $38,984.
Jennings's Overall Cost Of Living
Lower Than The National Average
Cost Of Living In Jennings Comparison Table
| Living Expense | Jennings | Missouri | National Average |
|---|---|---|---|
| Overall | 84 | 90 | 100 |
| Services | 97 | 97 | 100 |
| Groceries | 96 | 98 | 100 |
| Health | 51 | 76 | 100 |
| Housing | 93 | 95 | 100 |
| Transportation | 94 | 94 | 100 |
| Utilities | 100 | 96 | 100 |
Source: Cost of living index, normalized to US average = 100
Jennings, MO Weather
The average high in Jennings is 65.7° and the average low is 46.7°.
There are 70.0 days of precipitation each year.
Expect an average of 41.7 inches of precipitation each year with 15.6 inches of snow.
| Stat | Jennings |
|---|---|
| Average Annual High | 65.7 |
| Average Annual Low | 46.7 |
| Annual Precipitation Days | 70.0 |
| Average Annual Precipitation | 41.7 |
| Average Annual Snowfall | 15.6 |
Average High
Days of Rain
Source: NOAA climate normals (30-year)
Jennings, MO Photos
Rankings & Articles For Jennings


Locations Around Jennings
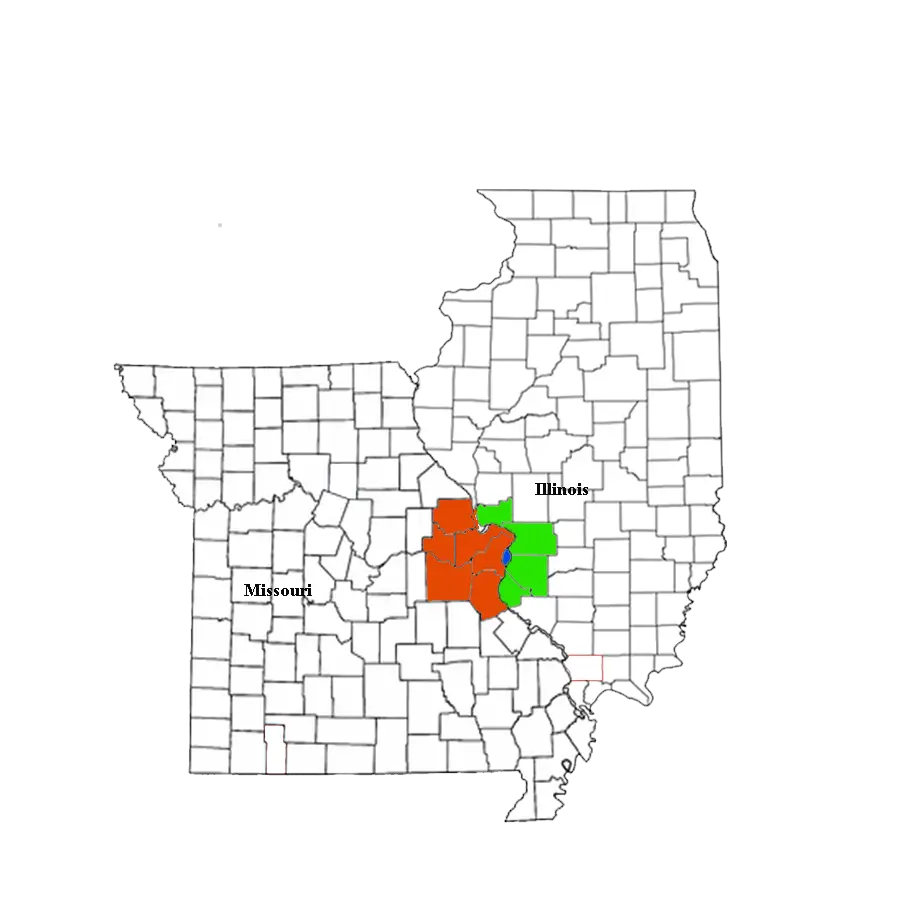
Map Of Jennings, MO
Best Places Around Jennings
Maryville, IL
Population 8,316
Swansea, IL
Population 14,710
Columbia, IL
Population 11,127
Edwardsville, IL
Population 26,474
Bethalto, IL
Population 9,239
Glen Carbon, IL
Population 13,977
Godfrey, IL
Population 17,712
Fairview Heights, IL
Population 16,745
Pontoon Beach, IL
Population 6,025
Collinsville, IL
Population 24,031
Jennings Demographics And Statistics
Population over time in Jennings
The current population in Jennings is 12,918. The population has decreased 12.9% from 2010.
| Year | Population | % Change |
|---|---|---|
| 2024 | 12,918 | 0.1% |
| 2023 | 12,900 | -0.7% |
| 2022 | 12,996 | -1.0% |
| 2021 | 13,129 | -10.5% |
| 2020 | 14,672 | -0.3% |
| 2019 | 14,712 | -0.6% |
| 2018 | 14,794 | 0.3% |
| 2017 | 14,743 | -0.0% |
| 2016 | 14,749 | -0.0% |
| 2015 | 14,755 | 0.2% |
| 2014 | 14,730 | -0.2% |
| 2013 | 14,755 | 0.1% |
| 2012 | 14,741 | -0.1% |
| 2011 | 14,756 | -0.5% |
| 2010 | 14,826 | - |
Race / Ethnicity in Jennings
See the full breakdown
Jennings is:
4.9% White with 634 White residents.
89.0% African American with 11,491 African American residents.
0.3% American Indian with 36 American Indian residents.
0.4% Asian with 51 Asian residents.
0.0% Hawaiian with 0 Hawaiian residents.
0.4% Other with 56 Other residents.
4.4% Two Or More with 565 Two Or More residents.
0.7% Hispanic with 85 Hispanic residents.
| Race | Jennings | MO | USA |
|---|---|---|---|
| White | 4.9% | 76.3% | 57.4% |
| African American | 89.0% | 10.9% | 11.9% |
| American Indian | 0.3% | 0.2% | 0.5% |
| Asian | 0.4% | 2.1% | 5.9% |
| Hawaiian | 0.0% | 0.1% | 0.2% |
| Other | 0.4% | 0.4% | 0.6% |
| Two Or More | 4.4% | 4.8% | 4.3% |
| Hispanic | 0.7% | 5.2% | 19.3% |
Gender in Jennings
See the full breakdown
Jennings is 58.4% female with 7,539 female residents.
Jennings is 41.6% male with 5,379 male residents.
| Gender | Jennings | MO | USA |
|---|---|---|---|
| Female | 58.4% | 50.7% | 50.5% |
| Male | 41.6% | 49.3% | 49.5% |
Highest level of educational attainment in Jennings for adults over 25
See the full breakdown
4.0% of adults in Jennings completed < 9th grade.
13.0% of adults in Jennings completed 9-12th grade.
39.0% of adults in Jennings completed high school / ged.
25.0% of adults in Jennings completed some college.
8.0% of adults in Jennings completed associate's degree.
8.0% of adults in Jennings completed bachelor's degree.
3.0% of adults in Jennings completed master's degree.
0.0% of adults in Jennings completed professional degree.
0.0% of adults in Jennings completed doctorate degree.
| Education | Jennings | MO | USA |
|---|---|---|---|
| < 9th Grade | 4.0% | 4.0% | 4.0% |
| 9-12th Grade | 13.0% | 5.0% | 6.0% |
| High School / GED | 39.0% | 30.0% | 26.0% |
| Some College | 25.0% | 21.0% | 19.0% |
| Associate's Degree | 8.0% | 8.0% | 9.0% |
| Bachelor's Degree | 8.0% | 20.0% | 22.0% |
| Master's Degree | 3.0% | 9.0% | 10.0% |
| Professional Degree | 0.0% | 2.0% | 2.0% |
| Doctorate Degree | 0.0% | 1.0% | 2.0% |
Household Income For Jennings, Missouri
See the full breakdown
8.8% of households in Jennings earn Less than $10,000.
9.9% of households in Jennings earn $10,000 to $14,999.
15.7% of households in Jennings earn $15,000 to $24,999.
10.5% of households in Jennings earn $25,000 to $34,999.
15.5% of households in Jennings earn $35,000 to $49,999.
17.0% of households in Jennings earn $50,000 to $74,999.
13.5% of households in Jennings earn $75,000 to $99,999.
6.0% of households in Jennings earn $100,000 to $149,999.
1.7% of households in Jennings earn $150,000 to $199,999.
1.3% of households in Jennings earn $200,000 or more.
| Income | Jennings | MO | USA |
|---|---|---|---|
| Less than $10,000 | 8.8% | 4.9% | 5.0% |
| $10,000 to $14,999 | 9.9% | 3.8% | 3.4% |
| $15,000 to $24,999 | 15.7% | 7.1% | 6.3% |
| $25,000 to $34,999 | 10.5% | 7.8% | 6.6% |
| $35,000 to $49,999 | 15.5% | 11.9% | 10.1% |
| $50,000 to $74,999 | 17.0% | 17.4% | 15.5% |
| $75,000 to $99,999 | 13.5% | 13.2% | 12.6% |
| $100,000 to $149,999 | 6.0% | 17.1% | 17.5% |
| $150,000 to $199,999 | 1.7% | 8.2% | 9.6% |
| $200,000 or more | 1.3% | 8.7% | 13.4% |
Source: U.S. Census ACS 5-year estimates (2024)


