Most Asian cities in North Dakota research summary. We analyzed North Dakota’s most recent Census data to determine the most Asian cities in North Dakota based on the percentage of Asian residents.
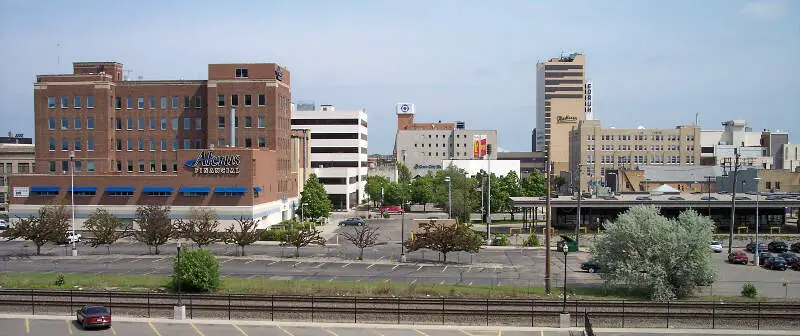
4.0% Asian · #1 most Asian in North Dakota
Fargo is the most populous city in the state of North Dakota, accounting for nearly 16% of the state population. Fargo is also the county seat of Cass County. According to the 2016 United States Census estimates, its population was 120,762, making it the 229th-most populous city in the United States. Fargo, along with its twin city of Moorhead, Minnesota, as well as the adjacent cities of West Fargo, North Dakota and Dilworth, Minnesota, form the core of the Fargo-Moorhead, ND-MN Metropolitan Statistical Area, which in 2016 contained a population of 238,124. In 2014, Forbes magazine ranked Fargo as the fourth fastest-growing small city in the United States.
Data | Crime | Cost of living | Movers
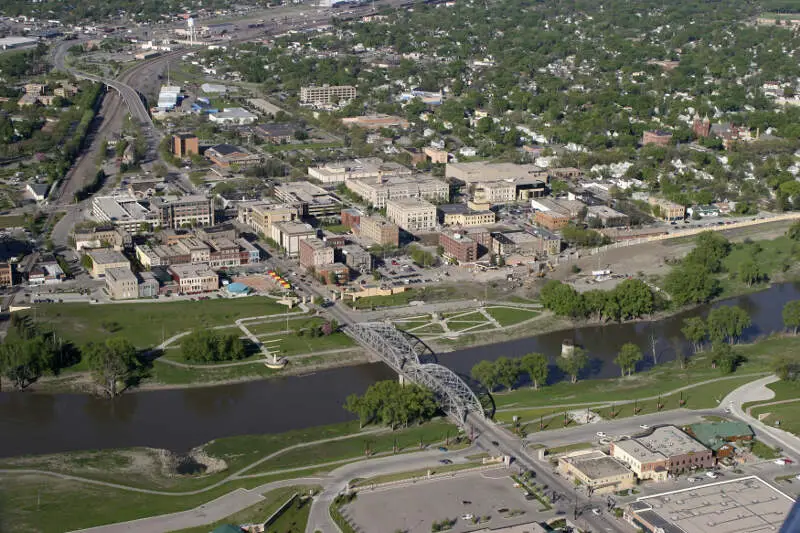
3.3% Asian · #2 most Asian in North Dakota
Grand Forks is the third-largest city in the State of North Dakota and is the county seat of Grand Forks County. According to the 2010 census, the city’s population was 52,838, while the total of the city and surrounding metropolitan area was 98,461. Grand Forks, along with its twin city of East Grand Forks, Minnesota, forms the center of the Grand Forks, ND-MN Metropolitan Statistical Area, which is often called Greater Grand Forks or The Grand Cities.
Data | Crime | Cost of living | Movers
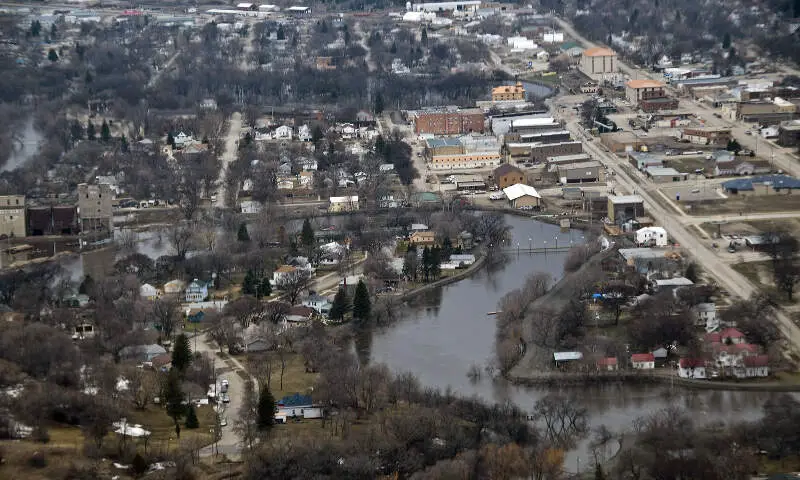
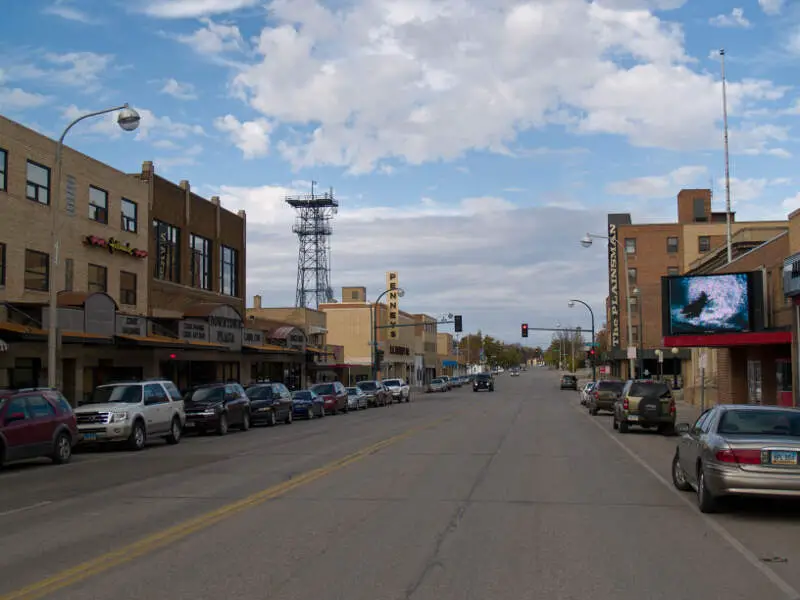
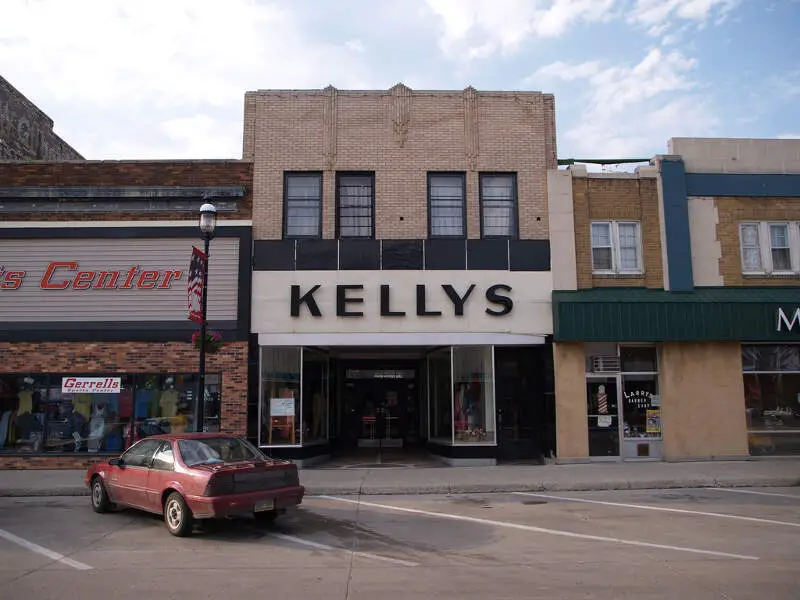
3.2% Asian · #3 most Asian in North Dakota
Valley City is a city in Barnes County, North Dakota, United States. It is the county seat of Barnes County. The population was 6,585 during the 2010 census, making it the thirteenth largest city in North Dakota. Valley City was founded in 1874.
Data | Crime | Cost of living | Movers
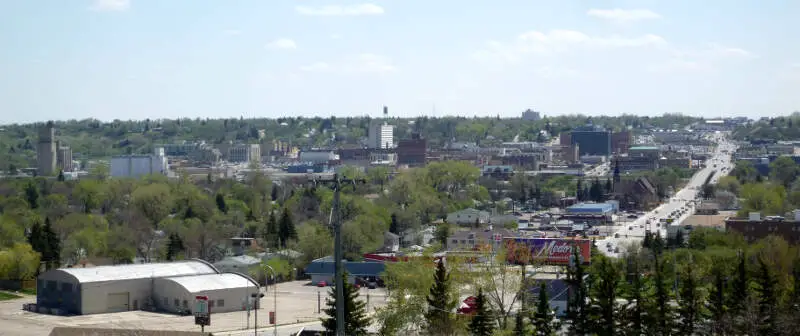
2.0% Asian · #4 most Asian in North Dakota
Minot MY-not) is a city in and the county seat of Ward County, North Dakota, United States, in the state’s north-central region. It is most widely known for the Air Force base located approximately 15 miles north of the city. With a population of 40,888 at the 2010 census, Minot is the fourth largest city in the state and a trading center for a large portion of northern North Dakota, southwestern Manitoba, and southeastern Saskatchewan. Founded in 1886 during the construction of the Great Northern Railway, Minot is also known as “Magic City”, commemorating its remarkable growth in size over a short time.
Data | Crime | Cost of living | Movers
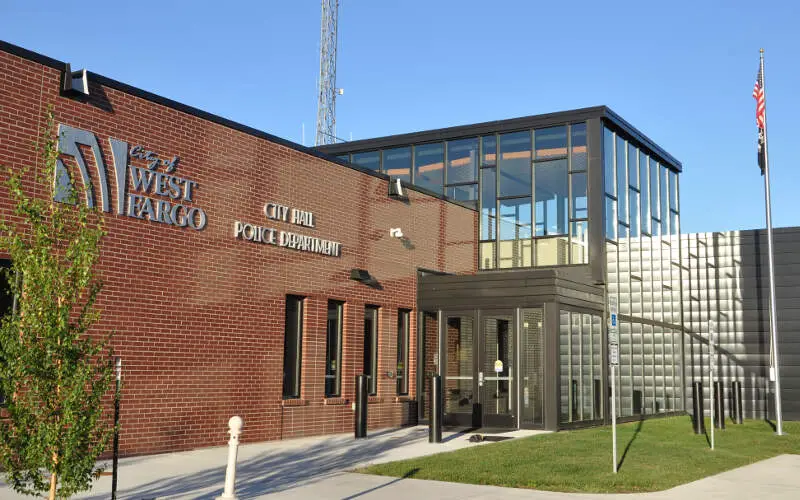
2.0% Asian · #5 most Asian in North Dakota
West Fargo is a city in Cass County, North Dakota, United States. It is, as of the 2016 Census Estimates, the fifth largest city in the state of North Dakota with a population estimated at 34,858, and it is one of the state’s fastest growing cities. West Fargo was founded in 1926. The city is part of the Fargo-Moorhead, ND-MN Metropolitan Statistical Area.
Data | Crime | Cost of living | Movers
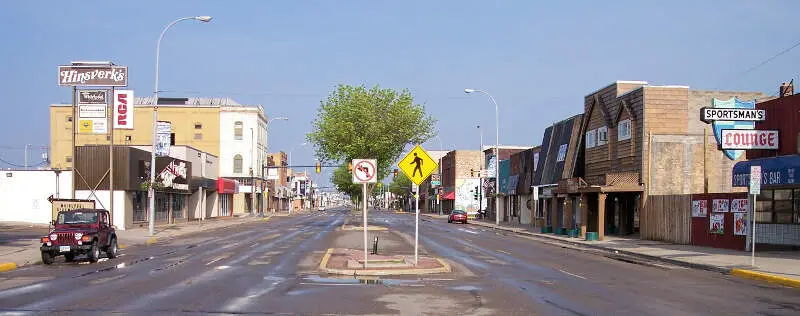
1.7% Asian · #6 most Asian in North Dakota
Williston is a city in and the county seat of Williams County, North Dakota, United States. The 2010 census gave its population as 14,716, and the Census Bureau gave the 2015 estimated population as 26,977, making Williston the sixth largest city in North Dakota. The North Dakota oil boom is largely responsible for the sharp increase in population.
Data | Crime | Cost of living | Movers
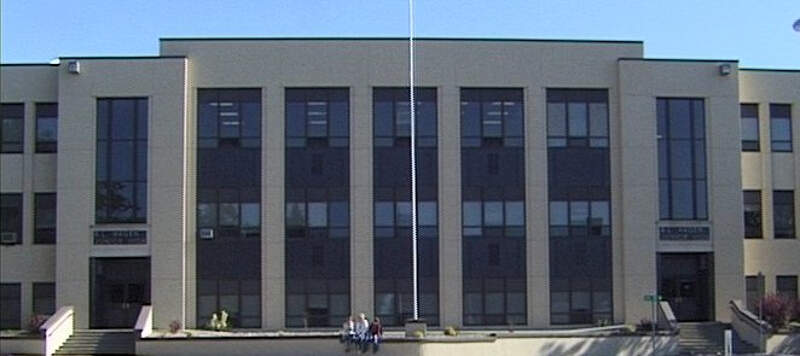
1.5% Asian · #7 most Asian in North Dakota
Wahpeton is a city in Richland County, in southeastern North Dakota, United States. It is located along the Bois de Sioux River at its confluence with the Otter Tail River, forming the Red River of the North. Wahpeton is the county seat of Richland County. The U.S. Census Bureau estimated the city’s 2015 population was 7,899.
Data | Crime | Cost of living | Movers
1.4% Asian · #8 most Asian in North Dakota
Dickinson is a city in Stark County, North Dakota, United States. It is the county seat of Stark County. The population was 17,787 at the 2010 census. The U.S. Census Bureau estimated 2015 population is 23,765.
Data | Crime | Cost of living | Movers
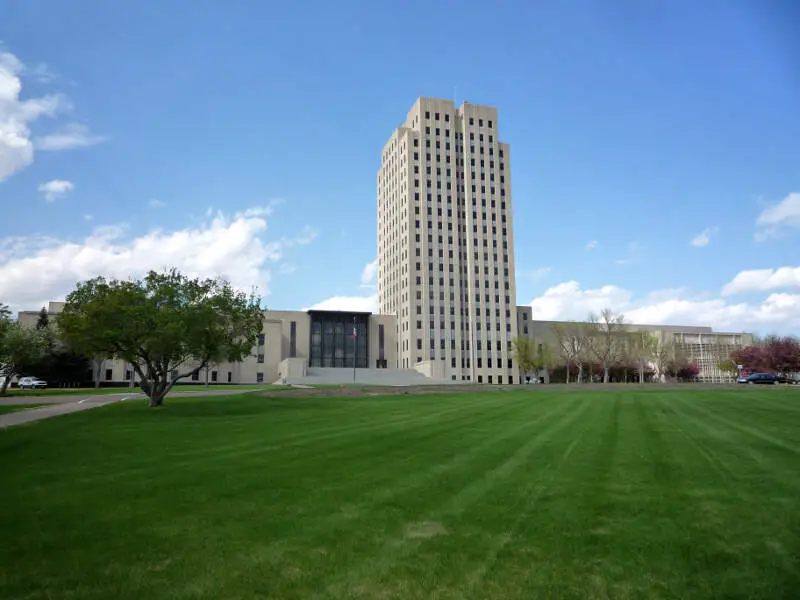
1.2% Asian · #9 most Asian in North Dakota
Bismarck is the capital of the U.S. state of North Dakota and the county seat of Burleigh County. It is the second-most populous city in North Dakota after Fargo. The city’s population was estimated in 2016 at 72,417, while its metropolitan population was 131,635. In 2015, Forbes magazine ranked Bismarck as the seventh fastest-growing small city in the United States.
Data | Crime | Cost of living | Movers
1.2% Asian · #10 most Asian in North Dakota
Devils Lake is a city in Ramsey County, North Dakota, United States. It is the county seat of Ramsey County. The population was 7,141 at the 2010 census. It is named after the nearby body of water, Devils Lake. The first house in Devils Lake was built in 1882. It was surveyed in 1883 and named Creelsburg and later Creel City, after the surveyor, Heber M. Creel. In 1884 it was renamed Devils Lake.
Data | Crime | Cost of living | Movers
The receipts
Compare the top ten
Pick a metric. The bars rescale. The red line is North Dakota’s statewide median.
On the map
Where North Dakota’s Asian communities live
Saturday Night Science
Methodology: How We Determined The Cities In North Dakota With The Largest Asian Population For 2026
We used Saturday Night Science to compare Census data on race across every place in North Dakota.
The Census’s most recently available data comes from the 2020-2024 American Community Survey.
Specifically, we looked at table B03002: Hispanic OR LATINO ORIGIN BY RACE. Here are the category names as defined by the Census:
- Hispanic or Latino
- White alone*
- Black or African American alone*
- American Indian and Alaska Native alone*
- Asian alone*
- Native Hawaiian and Other Pacific Islander alone*
- Some other race alone*
- Two or more races*
Our particular column of interest here was the number of people who identified as Asian alone.
We limited our analysis to cities with a population greater than 6,000 people. That left us with 12 cities.
We then calculated the percentage of residents that are Asian. The percentages ranked from 4.0% to 0.2%.
Finally, we ranked each city based on the percentage of Asian population, with a higher percentage being more Asian. Fargo took the distinction of being the most Asian, while Mandan was the least Asian city.
We updated this article for 2026. This report reflects our eleventh time ranking the cities in North Dakota with the largest Asian population.
The full plate
Cities In North Dakota By Asian Population
Click any column to sort. Search by city name.
| Rank | City | Population | Asian Population | % Asian |
|---|---|---|---|---|
| 1 | Fargo | 131,627 | 5,326 | 4.0% |
| 2 | Grand Forks | 59,042 | 1,958 | 3.3% |
| 3 | Valley City | 6,541 | 212 | 3.2% |
| 4 | Minot | 47,791 | 936 | 2.0% |
| 5 | West Fargo | 40,094 | 782 | 2.0% |
| 6 | Williston | 28,056 | 472 | 1.7% |
| 7 | Wahpeton | 8,010 | 120 | 1.5% |
| 8 | Dickinson | 25,357 | 348 | 1.4% |
| 9 | Bismarck | 75,556 | 931 | 1.2% |
| 10 | Devils Lake | 7,308 | 89 | 1.2% |
| 11 | Jamestown | 15,787 | 110 | 0.7% |
| 12 | Mandan | 24,522 | 40 | 0.2% |
Source: U.S. Census ACS 2020-2024. 12 cities with more than 6,000 residents.
Summary
Summary: Asian Populations Across North Dakota
If you’re looking for a breakdown of Asian populations across North Dakota according to the most recent data, this is an accurate list.
The most Asian cities in North Dakota are Fargo, Grand Forks, Valley City, Minot, West Fargo, Williston, Wahpeton, Dickinson, Bismarck, and Devils Lake.


