Racial diversity in South Dakota is a mixed bag.
There are parts of South Dakota where there’s a high level of diversity. But where will you find the most diverse places in South Dakota?
To answer that question, we went to the US Census data. Using Saturday Night Science, we measured the Gini coefficient for all 18 cities in South Dakota to rank them from most to least diverse.
#1 most diverse in South Dakota
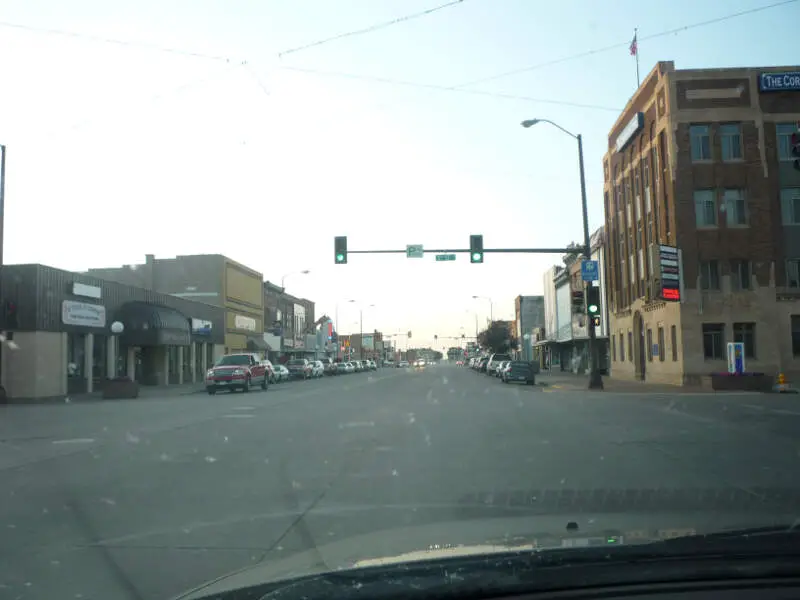
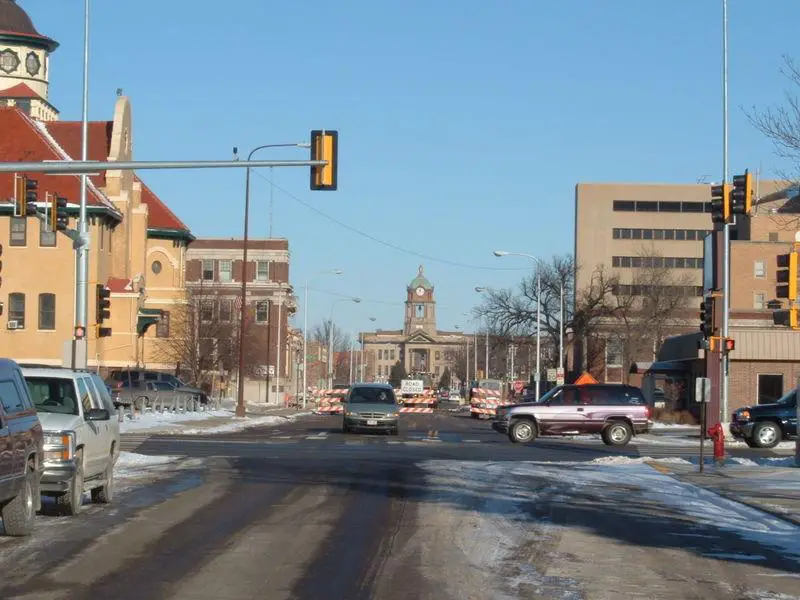
Huron is a city in Beadle County, South Dakota, United States. The population was 12,592 at the 2010 census. It is the county seat of Beadle County. Huron was the home of now-defunct Huron University. The Huron Plainsman, also referred to as the Plainsman, is the newspaper. The first settlement at Huron was made in 1880. The city was named after the Huron Indians. It is currently the ninth largest city in South Dakota, but it once was the fourth. Huron was in the running for capital of South Dakota but lost out to Pierre due to Pierres positioning.
Data | Crime | Cost of living | Movers
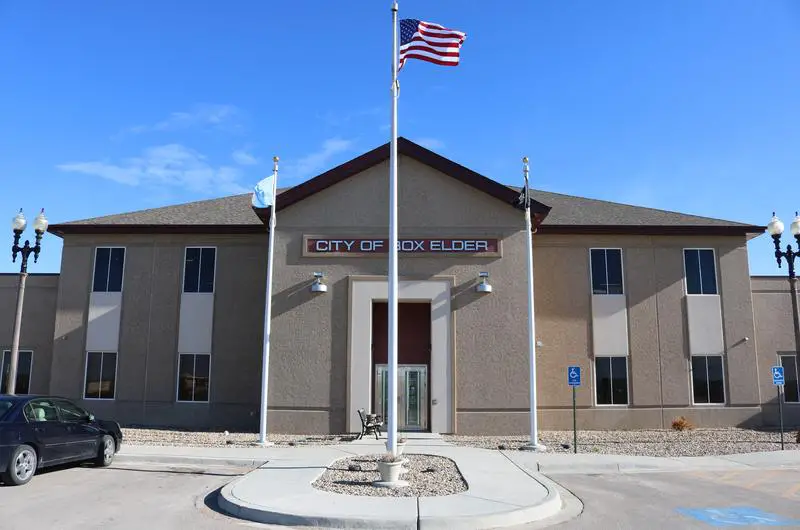
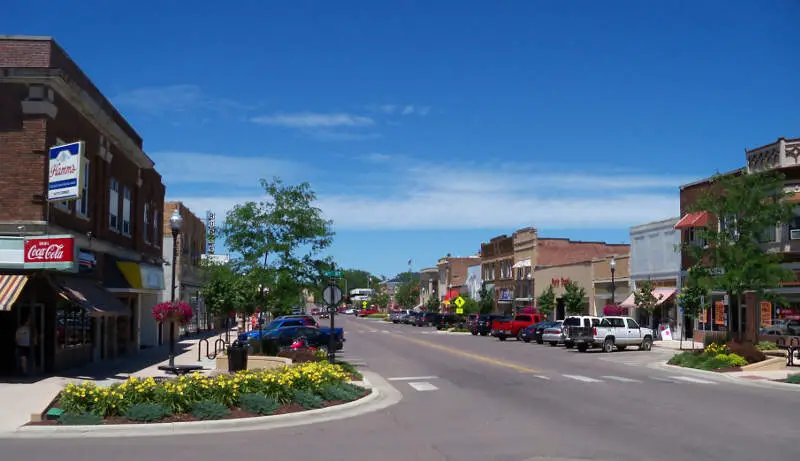
#2 most diverse in South Dakota
Data | Crime | Cost of living | Movers
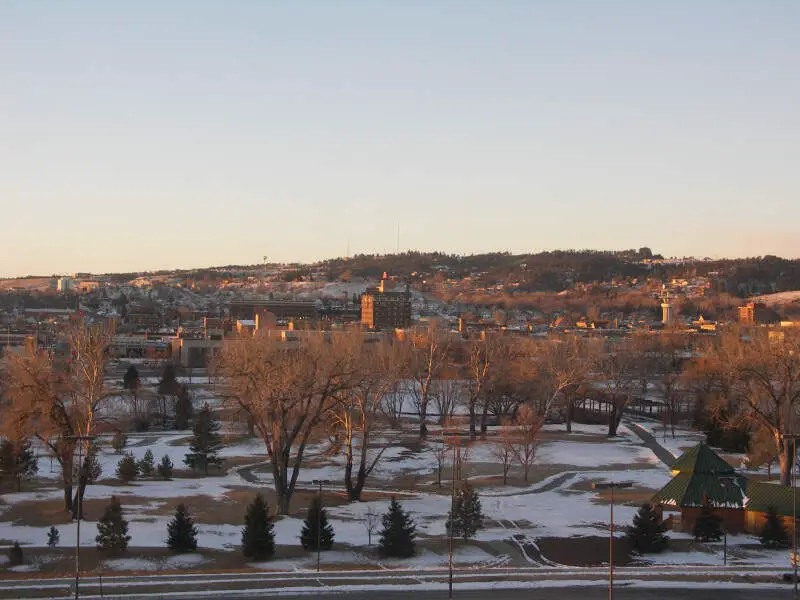
#3 most diverse in South Dakota
Rapid City is the second most populous city in South Dakota and the county seat of Pennington County. Named after Rapid Creek, on which the city is established, it is set against the eastern slope of the Black Hills mountain range. The population was 67,956 as of the 2010 Census. Known as the “Gateway to the Black Hills” and the “City of Presidents”, it is split by a low mountain ridge that divides the western and eastern parts of the city. Ellsworth Air Force Base is located on the outskirts of the city. Camp Rapid, a part of the South Dakota Army National Guard, is located in the western part of the city. The historic “Old West” town of Deadwood is nearby. In the neighboring Black Hills are the popular tourist attractions of Mount Rushmore, the Crazy Horse Memorial, Custer State Park, and Wind Cave National Park.
Data | Crime | Cost of living | Movers
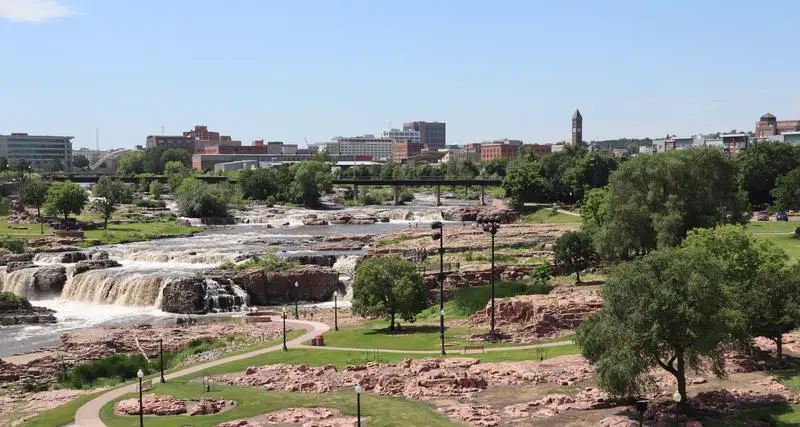
#4 most diverse in South Dakota
Sioux Falls is the most populous city in the U.S. state of South Dakota and the 145th-most populous city in the United States. It is the county seat of Minnehaha County. and also extends into Lincoln County to the south. It is the 47th fastest-growing city in the United States and the fastest-growing metro area in South Dakota, with a population increase of 22% between 2000 and 2010.
Data | Crime | Cost of living | Movers
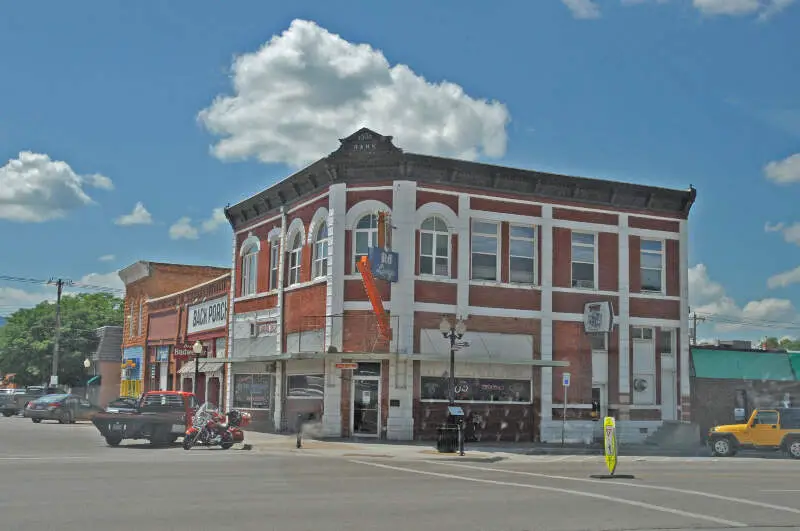
#5 most diverse in South Dakota
Data | Crime | Cost of living | Movers
#6 most diverse in South Dakota
Aberdeen is a city in and the county seat of Brown County, South Dakota, United States, about 125 miles northeast of Pierre. The city population was 26,091 at the 2010 census, making it the third most populous city in the state after Sioux Falls and Rapid City. Aberdeen is the principal city of the Aberdeen Micropolitan Statistical Area, which includes all of Brown and Edmunds counties and has a population of 40,602 in 2010. Aberdeen is considered a college town, being the home of both Northern State University and Presentation College.
Data | Crime | Cost of living | Movers
#7 most diverse in South Dakota
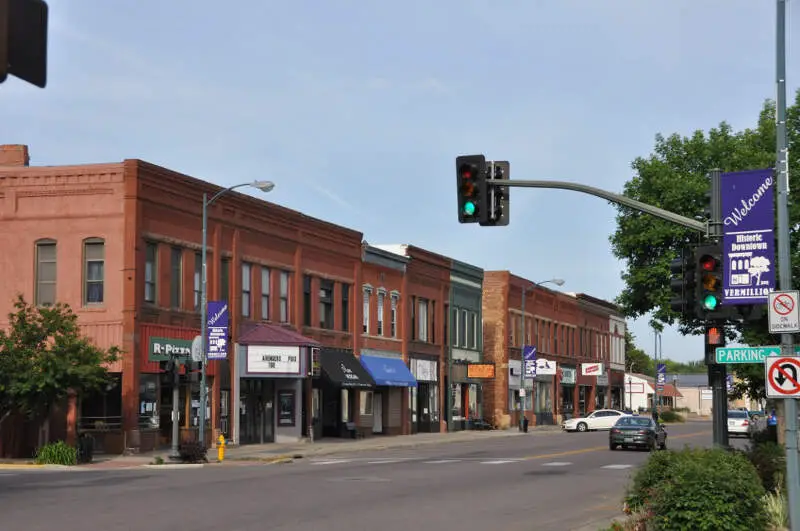
Vermillion is a city in and the county seat of Clay County, in the southeastern corner of the state of South Dakota, and the eleventh largest city in the state. According to the 2010 Census, the population was 10,571. The city lies atop a bluff near the Missouri River.
Data | Crime | Cost of living | Movers
#8 most diverse in South Dakota
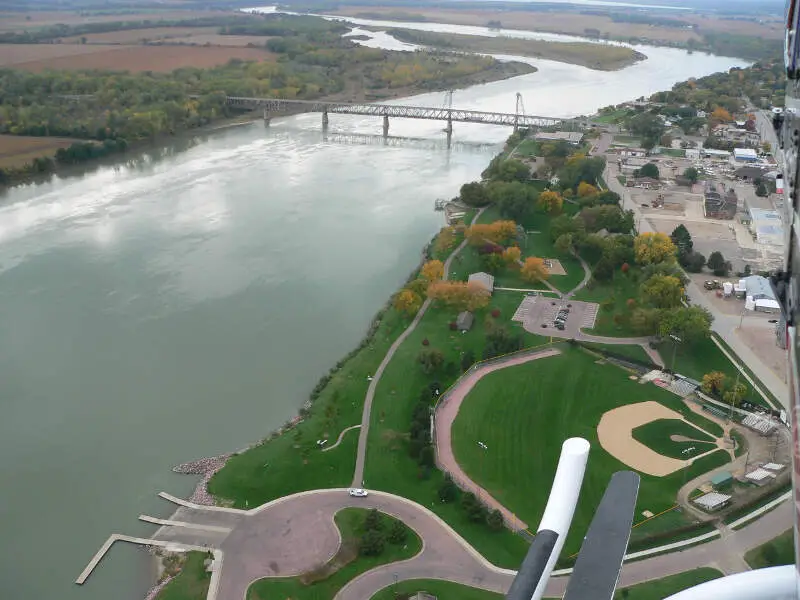
Yankton is a city in, and the county seat of, Yankton County, South Dakota, United States. The population was 14,454 at the 2010 census. Yankton is the principal city of the Yankton Micropolitan Statistical Area, which includes the entirety of Yankton County, and which had an estimated population of 22,702 as of July 1, 2015.
Data | Crime | Cost of living | Movers
#9 most diverse in South Dakota
Brookings is a city in Brookings County, South Dakota, United States. Brookings is the fourth largest city in South Dakota, with a population of 22,056 at the 2010 census. It is the county seat of Brookings County, and home to South Dakota State University, the largest institution of higher education in the state. Also found in Brookings are the South Dakota Art Museum, the Children’s Museum of South Dakota, the annual Brookings Summer Arts Festival, and the headquarters of a number of manufacturing companies and agricultural operations.
Data | Crime | Cost of living | Movers
#10 most diverse in South Dakota
Spearfish is a city in Lawrence County, South Dakota, United States. The population was 10,494 at the 2010 census.
Data | Crime | Cost of living | Movers
The receipts
Compare the top ten
Pick a metric. The bars rescale. The red line is South Dakota’s statewide median.
On the map
Where diversity lives in South Dakota
Saturday Night Science
Methodology: How we determined the most diverse cities in South Dakota for 2026
We still believe in the accuracy of data — especially from the Census — and Saturday Night Science. So that’s where we went to get the race breakdown across South Dakota.
That leads us to the Census’s most recently available data, the 2020-2024 American Community Survey data from the US Census.
Specifically, we looked at table B03002: HISPANIC OR LATINO ORIGIN BY RACE. Here are the category names as defined by the Census:
- White alone*
- Black or African American alone*
- American Indian and Alaska Native alone*
- Asian alone*
- Native Hawaiian and Other Pacific Islander alone*
- Some other race alone*
- Two or more races*
- Hispanic or Latino
We limited our analysis to non-CDPs with a population greater than 5,000 people. That left us with 18 cities.
We then calculated the HHI for each city by finding the racial breakdown of a city in percent terms, squaring them, and then adding the squares together. This left us with scores ranging from 4,137 (Huron) to 8,350 (Madison).
Finally, we ranked each city based on the HHI, with a lower score being more diverse than a high score. Huron took the distinction of being the most diverse, while Madison was the least diverse city.
We updated this article for 2026. This report is our eleventh time ranking the most diverse places in South Dakota.
The full plate
Race By City In South Dakota For 2026
Click any column to sort. Search by city name.
| Rank | City | Population | HHI | % White | % Black | % Hispanic | % Asian |
|---|---|---|---|---|---|---|---|
| 1 | Huron | 14,385 | 4,137 | 59.8% | 1.1% | 18.8% | 13.1% |
| 2 | Box Elder | 12,902 | 5,274 | 71.1% | 2.8% | 8.2% | 1.1% |
| 3 | Rapid City | 77,946 | 5,964 | 76.3% | 1.2% | 6.1% | 1.3% |
| 4 | Sioux Falls | 201,469 | 6,193 | 78.0% | 6.6% | 6.5% | 2.1% |
| 5 | Pierre | 13,948 | 6,493 | 79.7% | 0.0% | 4.0% | 0.8% |
| 6 | Aberdeen | 28,189 | 6,711 | 81.5% | 1.8% | 5.5% | 3.4% |
| 7 | Vermillion | 11,878 | 6,776 | 81.9% | 2.0% | 3.6% | 3.8% |
| 8 | Yankton | 15,540 | 7,263 | 84.8% | 2.2% | 6.5% | 0.4% |
| 9 | Brookings | 23,948 | 7,482 | 86.2% | 1.2% | 4.2% | 4.6% |
| 10 | Spearfish | 12,930 | 7,668 | 87.3% | 0.2% | 3.9% | 0.6% |
| 11 | Mitchell | 15,649 | 7,727 | 87.6% | 0.5% | 5.6% | 0.6% |
| 12 | Harrisburg | 8,519 | 7,819 | 88.1% | 0.0% | 6.4% | 0.7% |
| 13 | Brandon | 10,996 | 7,970 | 89.0% | 3.4% | 5.6% | 0.1% |
| 14 | Tea | 6,786 | 8,031 | 89.4% | 5.4% | 0.7% | 1.4% |
| 15 | Belle Fourche | 5,804 | 8,060 | 89.5% | 0.0% | 5.2% | 0.0% |
| 16 | Watertown | 23,044 | 8,109 | 89.9% | 0.8% | 2.9% | 0.7% |
| 17 | Sturgis | 7,086 | 8,319 | 91.1% | 1.9% | 3.0% | 0.0% |
| 18 | Madison | 6,094 | 8,350 | 91.3% | 1.3% | 4.3% | 0.8% |
Source: U.S. Census ACS 2020-2024. 18 cities with more than 5,000 residents.
Summary
Summary: Diversity Across South Dakota
If you’re looking for a scientific breakdown of diversity across South Dakota, this is an accurate list.
The most diverse cities in South Dakota are Huron, Box Elder, Rapid City, Sioux Falls, Pierre, Aberdeen, Vermillion, Yankton, Brookings, and Spearfish.


