
Which states are seeing the most extensive population decline over time? Actually, there are precisely ten of them. The rest of the states have seen slight increases or BIG gains in people. We’ll talk about where states people are moving to and why everyone’s leaving these states.
On average, every five years, Americans move to another home. It’s not always a dramatic move – say going from California to Colorado. Often, it’s close by – across town or to another part of the state.
As a population, the United States is getting older, and older people can’t move as quickly as younger people can. Nowadays, both mom and dad have jobs, making mobility a tougher pill to swallow. And data shows that we don’t job hop as often as we used to.
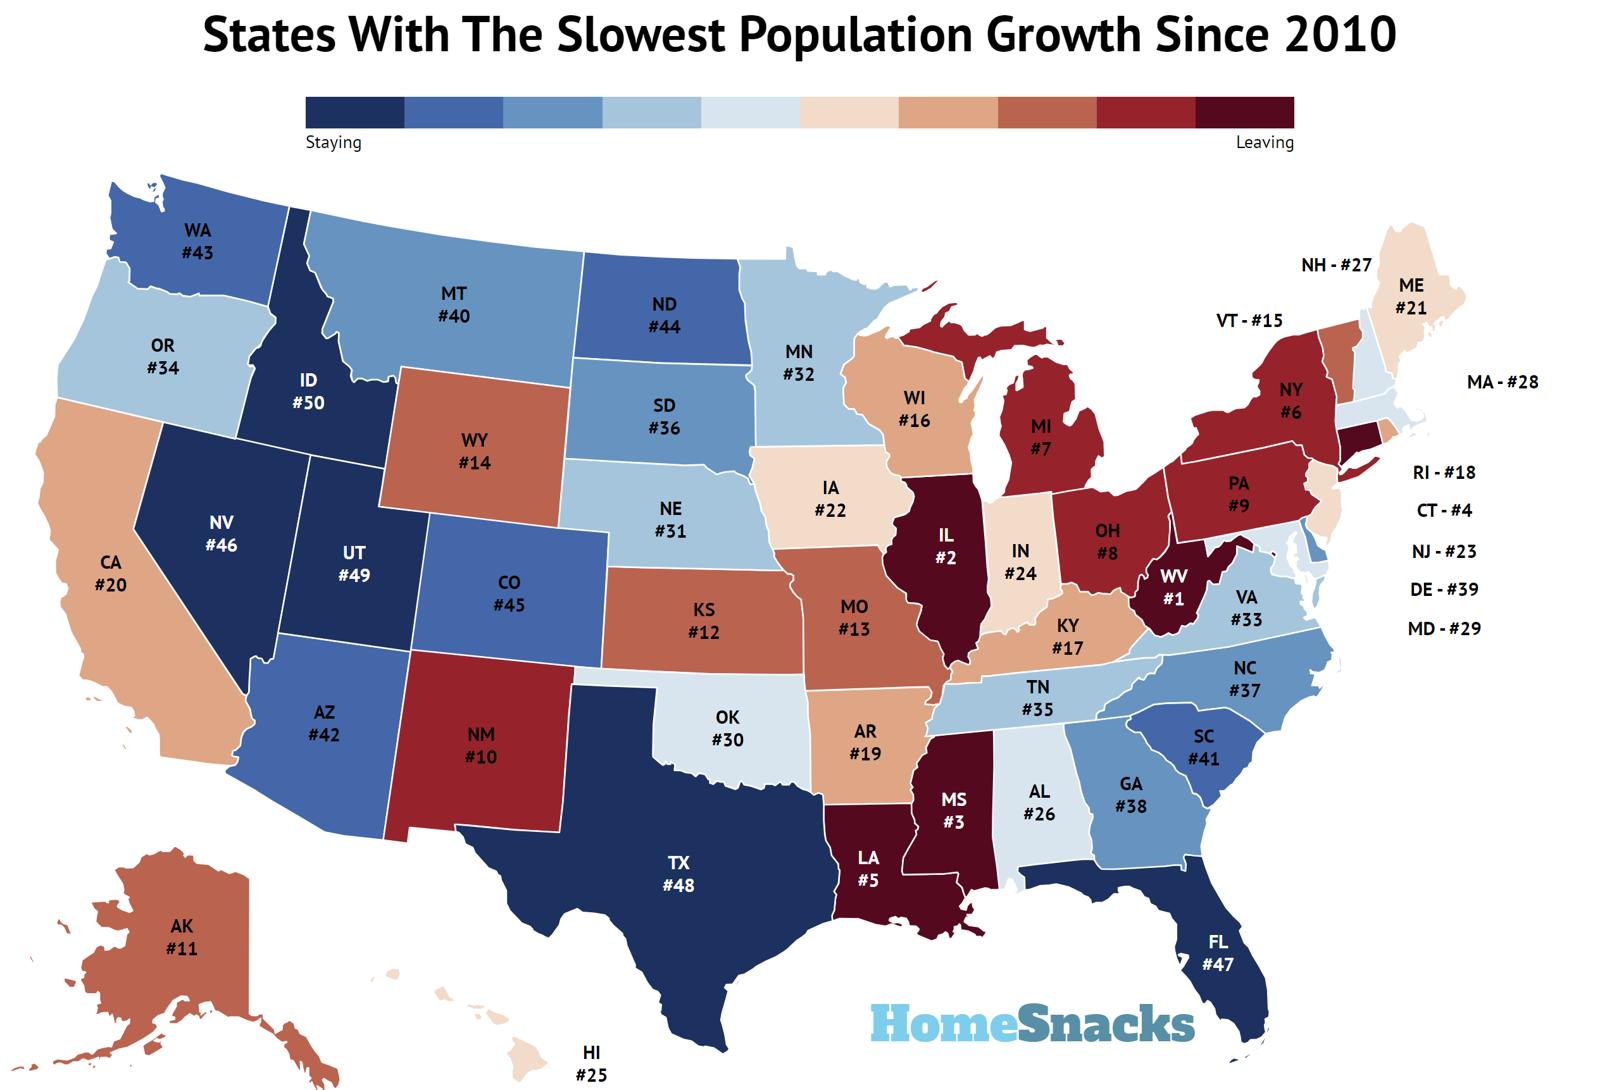
So, what states are losing their population the fastest? We analyzed the most recent Census to data to determine the states everyone is leaving.
Table Of Contents: Top Ten | Methodology | Table | Summary
Here are the 10 fastest shrinking states:
What state is losing the most population? The state losing the most population is West Virginia based on the most recent Census data.
For more reading, check out:
The 10 States Everyone Is Leaving In The United States
1. West Virginia

2022 Population: 1,774,035
2021 Population: 1,785,249
2010 Population: 1,854,230
1YR Population Change: -0.22%
Population Change Since 2010: -4.54%
Which state is the fastest shrinking of them all? West Virginia is. There are many many reasons why the Mountain State has been bleeding residents. Of course, jobs have a lot to do with it. The unemployment rate here is about 25% higher than the national average. Thusly, two thirds of the people leaving are doing so for bigger paychecks. Or actual paychecks. And most interestingly, nearly 3 in 10 people leaving are young. That’s really high. It’s like you grow up in West Virginia and then you get the heck outta West Virginia as soon as you can.
People here are poor – where 20% live in poverty. It’s an older, unhealthy population – and part of the decline is just people are dying. There were more deaths than births here last year.
Sadly, addictions are a big problem in West Virginia, too.

Wtf everything this guy said about West Virginia is completely false I bet he didn’t even go to WV…it’s practically always sunny…and no there are rarely and houses for sail and even though I live in Pennsylvania,my fam lives there and I see them 5x a year and it’s so awesome to be there
And Florida is also amazing I love Florida
And u didn’t put cali on there well u got a big thumbs down from me
2. Illinois

2022 Population: 12,582,515
2021 Population: 12,690,341
2010 Population: 12,841,578
1YR Population Change: -0.26%
Population Change Since 2010: -2.27%
-.64% last year, -1.41% last ten years
Our next fastest shrinking state is Illinois. Why? Taxes. The weather. Chicago. Crime. Nothing to do.
Every 5 minutes, someone leaves Illinois for another state. This state lost 104,000 people last year. Illinois is the only midwest state that didn’t grow last year, outside of Kansas.
Because the population has shrunk so fast here, the demand for housing has also gone down quite a bit. That’s impacted one of Illinois’ biggest industries – real estate. Less homes means less property taxes, which means the economy has sinking even faster.
And, they’re talking about hiking income taxes even more here this year. Which will mean more people will likely leave. Bye Illinois!
3. Mississippi

2022 Population: 2,938,928
2021 Population: 2,949,582
2010 Population: 2,970,322
1YR Population Change: 0.03%
Population Change Since 2010: -1.03%
I live in Mississippi. Have my whole life. Never thought it was that bad. We have a problem with high school drop outs but the cost of living of is the best in the country. So you dont have to make a killing to make a decent living and its not over populated. Education is Mississippis problem and corrupt businesses keep people under paid.
4. Connecticut

2022 Population: 3,608,706
2021 Population: 3,603,691
2010 Population: 3,579,899
1YR Population Change: 0.23%
Population Change Since 2010: 1.04%
Mappy has no idea what day to day costs are. I haven’t really told you guys, but his family has been living with me for the last three years. I might have to do something about that.
But for now, we drop in on Connecticut for a LIVE VIEW of a very happy family packing their shit. Like Alaska before it, Connecticut’s population has dropped for six consecutive years. Families like this are moving out every day.
That’s kind of a weird way to pack. What are they doing with the plastic like that?
More than one in three people leave Connecticut because they retired. And three quarters are relatively wealthy folks. Connecticut had a net loss of 30,000 people last year – many to nearby New York, Massachusetts and California for some reason.
5. Louisiana

2022 Population: 4,588,023
2021 Population: 4,627,047
2010 Population: 4,544,996
1YR Population Change: -0.31%
Population Change Since 2010: 0.63%
We go down south for the first time. And actually for the last time. Louisiana is only southern state that didn’t increase residents last year. Even Mississippi gained a few people. As we mentioned earlier, the south and the west are where we’re all moving.
The biggest destination for Louisianans is next door in Texas. A whopping 70% of people leaving Louisiana are doing it for better jobs. As you may know, if you don’t work in energy, the fishing industry, or in agriculture, it’s tough findin work here, mister.
And the lower the oil prices go, the poorer everyone here gets. Sadly.
I live in Louisiana and I love it. Just based on the stuff you used to make the list, like weather and bugs, Louisiana should be #1.
We have over 50% of the entire country’s wetlands, which makes it a major hotspot for mosquitoes, Crime rate is pretty high, and poverty is really high. Drugs are also a problem.
6. New York

2022 Population: 19,673,200
2021 Population: 19,854,526
2010 Population: 19,402,640
1YR Population Change: -0.52%
Population Change Since 2010: 0.87%
The northeastern part of the US has been hit hard by an outward population migration. It’s been four consecutive years that the Empire State has lost people. Many of them are from upstate, a region which has been hit hard with manufacturing job losses. And the cold climate doesn’t help.
But it’s not just folks leavin the sticks. Last year, 131 people left New York City every single day. Lots of folks are burned out by the fast-paced life, and the high cost of living is just wearing on people.
Of course – many people are moving TO New York City as well. Two thirds came from abroad – that means other countries.
A lot of New Yorkers are leaving for southern states – especially Florida – which is the 5th fastest growing state of all. Mostly because it’s warm here, and there’s no income tax.
New Yorkers also flee to nearby New Jersey and Pennsylvania at a high clip.
Because theirs so much to see and do…Great restaurant’s thearters shows and parks to see or visit. As any where else when you’re in a large city with so many people their will definitely be some types of crimes committed.
Sight seeking is a great thing to do in a city such as this.You just need to watch out to not draw to much attention to yourself as a tourist.
7. Michigan
2022 Population: 10,033,281
2021 Population: 10,038,117
2010 Population: 9,877,495
1YR Population Change: 0.04%
Population Change Since 2010: 1.62%
Michigan is one of the greatest states to live and to visit! Not only are we surrounded by 4 out of 5 of the biggest fresh water lakes in the US with awesome diverse beaches…we also have great people, great agriculture, good green energy, good tourism. great fishing, great hunting, and outstanding students. I’m from Grand Rapids, live in Bay City, and work in Saginaw.
There’s nothing bad about living in Michigan. We have luscious wildlife, great beaches, and a determined people. Come join us! If you dare! lol
8. Ohio

2022 Population: 11,759,697
2021 Population: 11,765,227
2010 Population: 11,540,983
1YR Population Change: 0.22%
Population Change Since 2010: 2.12%
I’m from Canada and visit some good friends in Ohio. I love it there. I feel free and not afraid to be weird. There’s so many good concerts to see. Plus in September there’s the Lost Lands festival in Legend Valley.
9. Pennsylvania

2022 Population: 12,972,091
2021 Population: 13,013,614
2010 Population: 12,712,343
1YR Population Change: -0.08%
Population Change Since 2010: 1.96%
I live in Pa, I have been to Georgia and Florida to hang out with my family – and they were both AWESOME. Not sure what this guy is on as far as trashing the weather down there, but I felt it with my own skin and it was great 🙂
10. New Mexico

2022 Population: 2,113,476
2021 Population: 2,116,950
2010 Population: 2,064,756
1YR Population Change: 0.04%
Population Change Since 2010: 2.40%
I live in NM and there is a low crime rate I’m not saying it’s the best state, that goes to Cali, but in ABQ there is a lot I mean ALOT of things to do and the only sketchy places are in abq but there are very few and the cops here are amazing.
Methodology: How did we determine the states people are leaving for 2026?
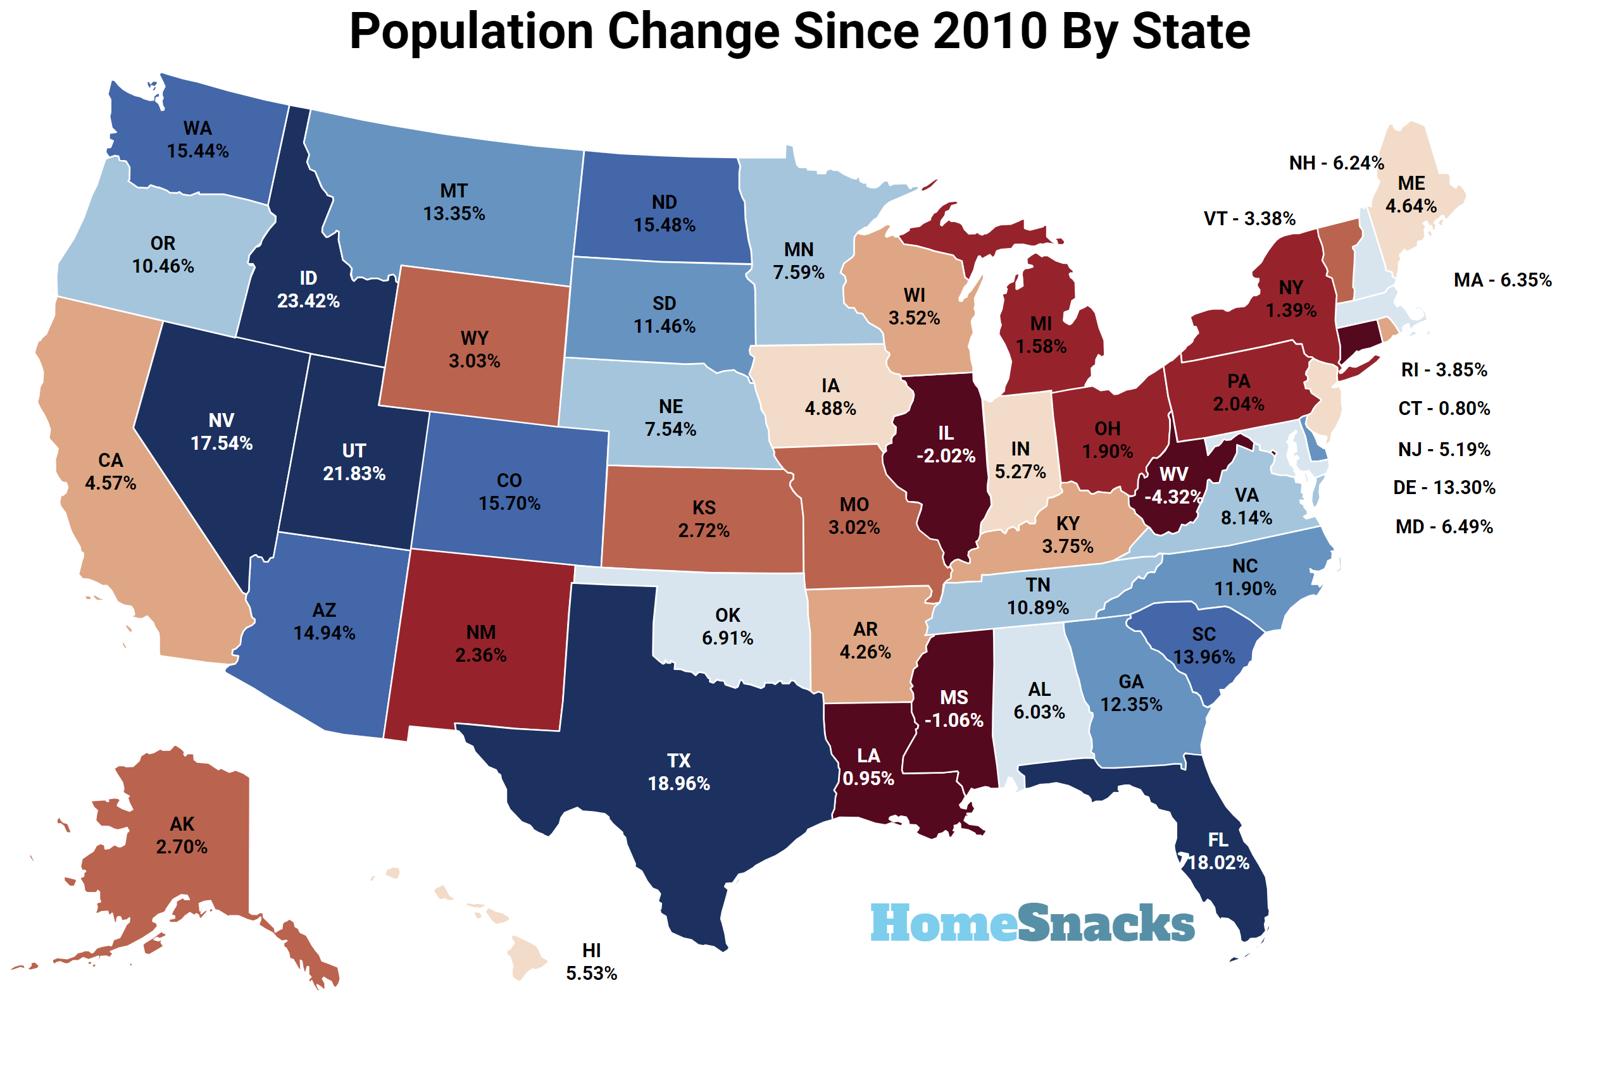
To determine the fastest-shrinking states in the United States, we used Saturday Night Science to look at the estimated population of each state from the 2010 Census and compared that against data from the St. Louis Fed Estimate for the most recent data year, 2022.
We then calculated the percent change change in the population for each of the states. Finally, we ranked each state from lowest percent population change to highest percent for that 16 year period.
What state is growing the slowest? The state growing the slowest is West Virginia.
Wrapping Up The Fastest Shrinking States In The US
So, next time you’re looking around, wondering why on earth you’re stuck. Remember this: You’re not. Take action and move on to greener pastures. You’ll be a lot happier. You can always come back.
Settle down, it’ll all be clear
Don’t pay no mind to me I don’t want to be here
Just know I’m not alone
I don’t want to make this state my home.
The slowest growing states in the United States are West Virginia, Illinois, Mississippi, Connecticut, Louisiana, New York, Michigan, Ohio, Pennsylvania, and New Mexico.
For more reading, check out:
Table: The Fastest Shrinking States In The US
| Rank | State | Population 2022 | Population 2021 | Population 2010 | 1YR Population Change | Population Change Since 2010 |
|---|---|---|---|---|---|---|
| 1 | West Virginia | 1,774,035 | 1,785,249 | 1,854,230 | -0.22% | -4.54% |
| 2 | Illinois | 12,582,515 | 12,690,341 | 12,841,578 | -0.26% | -2.27% |
| 3 | Mississippi | 2,938,928 | 2,949,582 | 2,970,322 | 0.03% | -1.03% |
| 4 | Connecticut | 3,608,706 | 3,603,691 | 3,579,899 | 0.23% | 1.04% |
| 5 | Louisiana | 4,588,023 | 4,627,047 | 4,544,996 | -0.31% | 0.63% |
| 6 | New York | 19,673,200 | 19,854,526 | 19,402,640 | -0.52% | 0.87% |
| 7 | Michigan | 10,033,281 | 10,038,117 | 9,877,495 | 0.04% | 1.62% |
| 8 | Ohio | 11,759,697 | 11,765,227 | 11,540,983 | 0.22% | 2.12% |
| 9 | Pennsylvania | 12,972,091 | 13,013,614 | 12,712,343 | -0.08% | 1.96% |
| 10 | New Mexico | 2,113,476 | 2,116,950 | 2,064,756 | 0.04% | 2.40% |
| 11 | Alaska | 733,276 | 734,923 | 714,031 | 0.02% | 2.71% |
| 12 | Kansas | 2,936,716 | 2,937,946 | 2,858,850 | 0.13% | 2.86% |
| 13 | Missouri | 6,177,168 | 6,170,393 | 5,996,118 | 0.31% | 3.34% |
| 14 | Wyoming | 581,629 | 579,548 | 564,513 | 0.42% | 3.46% |
| 15 | Vermont | 647,110 | 647,093 | 625,982 | 0.05% | 3.43% |
| 16 | Wisconsin | 5,890,543 | 5,879,978 | 5,690,263 | 0.35% | 3.88% |
| 17 | Kentucky | 4,511,563 | 4,507,600 | 4,348,662 | 0.32% | 4.08% |
| 18 | Rhode Island | 1,093,842 | 1,097,092 | 1,053,337 | 0.19% | 4.05% |
| 19 | Arkansas | 3,046,404 | 3,028,443 | 2,921,995 | 0.70% | 4.99% |
| 20 | California | 39,040,616 | 39,145,060 | 37,332,685 | -0.19% | 4.37% |
| 21 | Maine | 1,389,338 | 1,378,787 | 1,327,730 | 0.46% | 5.12% |
| 22 | Iowa | 3,199,693 | 3,197,944 | 3,050,738 | 0.23% | 5.12% |
| 23 | New Jersey | 9,260,817 | 9,269,175 | 8,803,729 | 0.32% | 5.53% |
| 24 | Indiana | 6,832,274 | 6,813,798 | 6,490,528 | 0.44% | 5.73% |
| 25 | Hawaii | 1,439,399 | 1,446,745 | 1,363,945 | -0.30% | 5.22% |
| 26 | Alabama | 5,073,903 | 5,050,380 | 4,785,492 | 0.68% | 6.75% |
| 27 | New Hampshire | 1,399,003 | 1,387,494 | 1,316,872 | 0.22% | 6.47% |
| 28 | Massachusetts | 6,982,740 | 6,991,951 | 6,565,524 | 0.27% | 6.64% |
| 29 | Maryland | 6,163,981 | 6,175,045 | 5,788,584 | 0.26% | 6.77% |
| 30 | Oklahoma | 4,019,271 | 3,991,634 | 3,759,603 | 0.86% | 7.83% |
| 31 | Nebraska | 1,968,060 | 1,964,253 | 1,830,051 | 0.52% | 8.11% |
| 32 | Minnesota | 5,714,300 | 5,717,968 | 5,311,147 | 0.41% | 8.04% |
| 33 | Virginia | 8,679,099 | 8,657,348 | 8,025,773 | 0.42% | 8.60% |
| 34 | Oregon | 4,239,379 | 4,256,465 | 3,838,048 | -0.14% | 10.30% |
| 35 | Tennessee | 7,048,976 | 6,963,709 | 6,356,671 | 1.10% | 12.11% |
| 36 | South Dakota | 909,869 | 896,299 | 816,325 | 1.04% | 12.62% |
| 37 | North Carolina | 10,695,965 | 10,567,100 | 9,558,915 | 1.30% | 13.35% |
| 38 | Georgia | 10,913,150 | 10,790,385 | 9,713,521 | 1.06% | 13.55% |
| 39 | Delaware | 1,019,459 | 1,004,881 | 899,816 | 1.22% | 14.68% |
| 40 | Montana | 1,122,878 | 1,106,366 | 990,641 | 0.88% | 14.35% |
| 41 | South Carolina | 5,282,955 | 5,193,848 | 4,635,943 | 1.71% | 15.91% |
| 42 | Arizona | 7,365,684 | 7,272,487 | 6,408,312 | 0.89% | 15.96% |
| 43 | Washington | 7,784,477 | 7,741,433 | 6,743,226 | 0.36% | 15.86% |
| 44 | North Dakota | 778,912 | 777,982 | 674,526 | 0.64% | 16.22% |
| 45 | Colorado | 5,841,039 | 5,811,596 | 5,048,644 | 0.63% | 16.42% |
| 46 | Nevada | 3,177,421 | 3,146,632 | 2,703,284 | 0.53% | 18.16% |
| 47 | Florida | 22,245,521 | 21,830,708 | 18,849,098 | 1.64% | 19.96% |
| 48 | Texas | 30,029,848 | 29,561,286 | 25,244,310 | 1.58% | 20.83% |
| 49 | Utah | 3,381,236 | 3,339,284 | 2,775,326 | 1.08% | 23.15% |
| 50 | Idaho | 1,938,996 | 1,904,537 | 1,571,010 | 1.33% | 25.06% |