Racial diversity in Vermont is a mixed bag.
There are parts of Vermont where there’s a high level of diversity. But where will you find the most diverse places in Vermont?
To answer that question, we went to the US Census data. Using Saturday Night Science, we measured the Gini coefficient for all 12 cities in Vermont to rank them from most to least diverse.
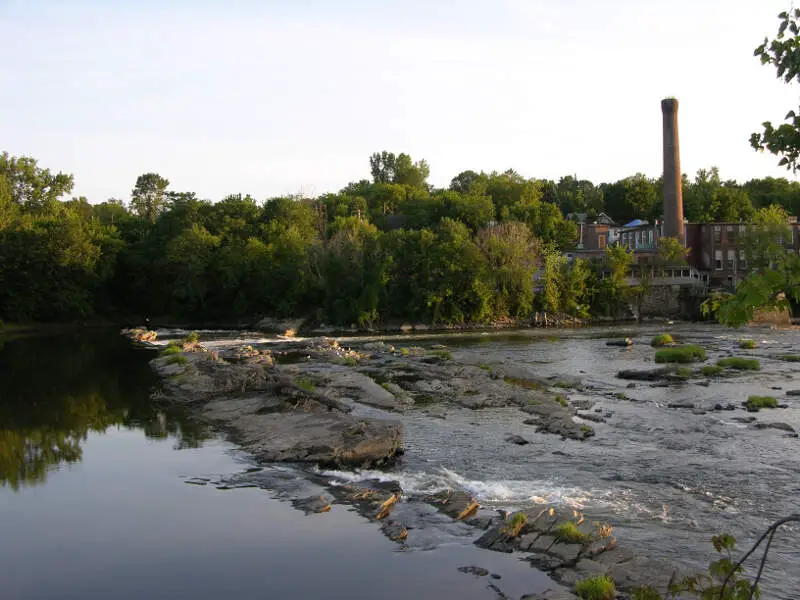
#1 most diverse in Vermont
Winooski is a city in Chittenden County, Vermont, United States. Located on the Winooski River, as of the 2010 U.S. Census the municipal population was 7,267. The city is the most densely populated municipality in northern New England, an area comprising the states of Maine, New Hampshire, and Vermont. It is the smallest in area of Vermont’s nine incorporated cities. As part of the Burlington, Vermont metropolitan area, it is bordered by Burlington, Colchester, and South Burlington.
Data | Crime | Cost of living | Movers
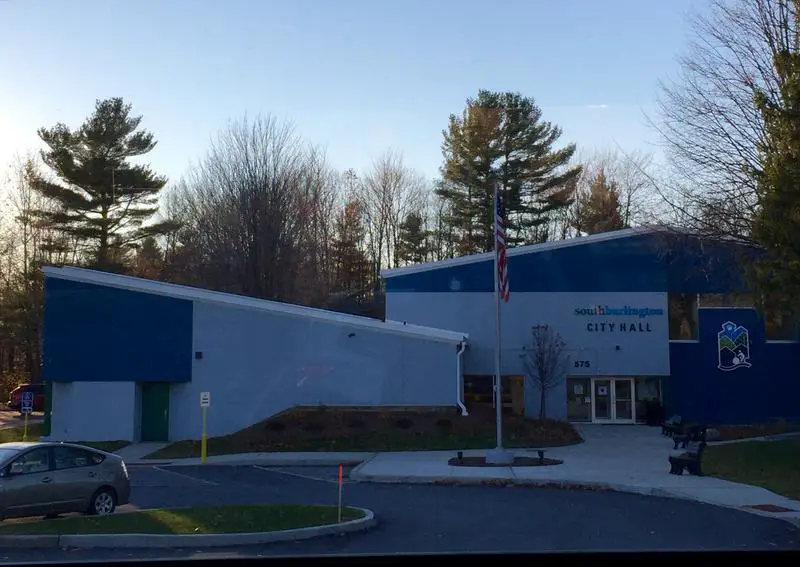
#2 most diverse in Vermont
South Burlington is a city in Chittenden County, Vermont, United States. It is the second largest city in the U.S. state of Vermont and home to the headquarters of Ben & Jerry’s and Vermont’s largest mall, the University Mall. It is also one in the principal municipalities of the Burlington, Vermont metropolitan area.
Data | Crime | Cost of living | Movers
#3 most diverse in Vermont
Middlebury is the shire town of Addison County, Vermont, United States. The population was 8,496 at the 2010 census. Middlebury is home to Middlebury College and the Henry Sheldon Museum of Vermont History.
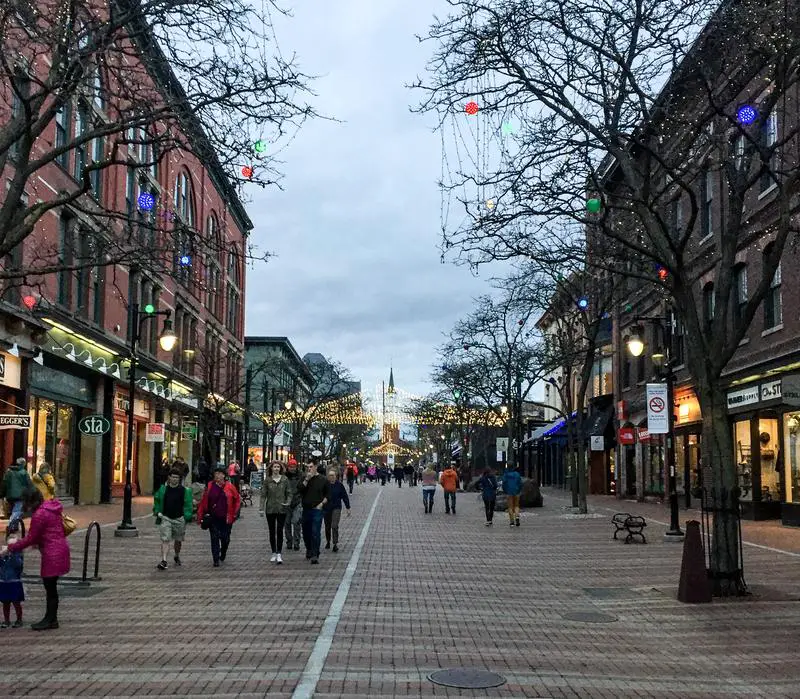
#4 most diverse in Vermont
Burlington is the most populous city in the U.S. state of Vermont and the seat of Chittenden County. It is located 45 miles south of the Canada-United States border and 94 miles south of Canada’s second most populous municipality, Montreal. The city’s population was 42,452 according to a 2015 U.S. census estimate. It is the least populous municipality in the United States to be the most populous incorporated area in a state.
Data | Crime | Cost of living | Movers
#5 most diverse in Vermont
Shelburne is a town in Chittenden County, Vermont, United States. Located along the shores of Lake Champlain, Shelburne is a suburb of Burlington, the largest city in the state of Vermont. Shelburne’s town center lies approximately 7 miles south of Burlington’s city’s center. The population of Shelburne was 7,144 at the 2010 census.
The main settlement of Shelburne in the center of town is a census-designated place, with a population of 592 at the 2010 census. The town is the wealthiest municipality in both Chittenden County and the Burlington, Vermont metropolitan area.
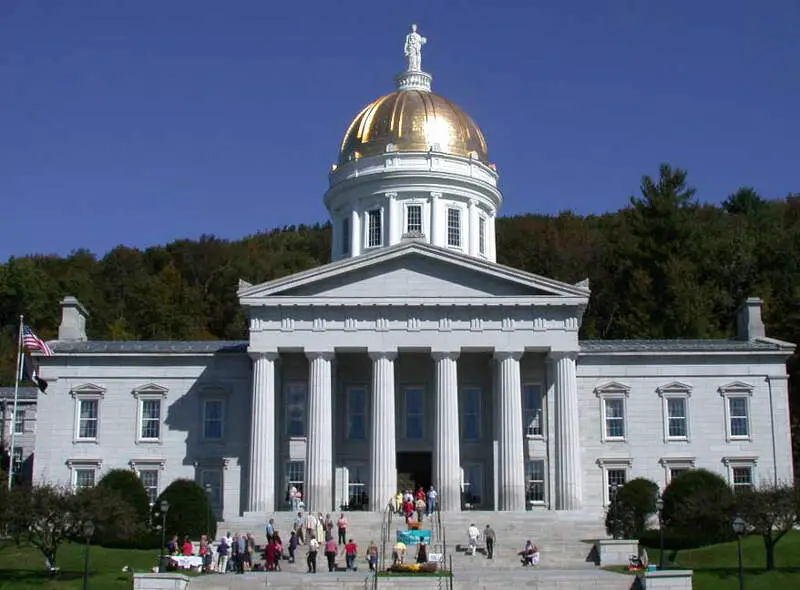
#6 most diverse in Vermont
Montpelier is the capital city of the U.S. state of Vermont and the seat of Washington County. As the site of Vermont’s state government, it is the least populous state capital in the United States. The population was 7,855 at the 2010 census. However, the daytime population swells to about 21,000, due to the large number of jobs within city limits. The Vermont College of Fine Arts and New England Culinary Institute are located in the municipality. It was named for Montpellier, France.
Data | Crime | Cost of living | Movers
#7 most diverse in Vermont
St. Johnsbury is the shire town of Caledonia County, Vermont, United States. The population was 7,603 at the 2010 census. St. Johnsbury is located approximately 10 miles northwest of the Connecticut River and 48 miles south of the Canada-U.S. border.
#8 most diverse in Vermont
Data | Crime | Cost of living | Movers
#9 most diverse in Vermont
Bennington is a town in Bennington County, Vermont, in the United States. It is one of two shire towns of the county, the other being Manchester. The population is 15,431, as of 2014 US Census estimates. Bennington is the most populous town in southern Vermont, the third-largest town in Vermont and the sixth-largest municipality in the state including the cities of Burlington, Rutland, and South Burlington in the count.
#10 most diverse in Vermont
Brattleboro, originally Brattleborough, is a town in Windham County, Vermont, United States. The most populous municipality abutting Vermont’s eastern border, Brattleboro is located about 10 miles north of the Massachusetts state line, at the confluence of Vermont’s West River and the Connecticut. In 2014, Brattleboro’s population was estimated by the U.S. Census Bureau to be 11,765.
The receipts
Compare the top ten
Pick a metric. The bars rescale. The red line is Vermont’s statewide median.
On the map
Where diversity lives in Vermont
Saturday Night Science
Methodology: How we determined the most diverse cities in Vermont for 2026
We still believe in the accuracy of data — especially from the Census — and Saturday Night Science. So that’s where we went to get the race breakdown across Vermont.
That leads us to the Census’s most recently available data, the 2020-2024 American Community Survey data from the US Census.
Specifically, we looked at table B03002: HISPANIC OR LATINO ORIGIN BY RACE. Here are the category names as defined by the Census:
- White alone*
- Black or African American alone*
- American Indian and Alaska Native alone*
- Asian alone*
- Native Hawaiian and Other Pacific Islander alone*
- Some other race alone*
- Two or more races*
- Hispanic or Latino
We limited our analysis to non-CDPs with a population greater than 5,000 people. That left us with 12 cities.
We then calculated the HHI for each city by finding the racial breakdown of a city in percent terms, squaring them, and then adding the squares together. This left us with scores ranging from 6,101 (Winooski) to 8,590 (Rutland).
Finally, we ranked each city based on the HHI, with a lower score being more diverse than a high score. Winooski took the distinction of being the most diverse, while Rutland was the least diverse city.
We updated this article for 2026. This report is our eleventh time ranking the most diverse places in Vermont.
The full plate
Race By City In Vermont For 2026
Click any column to sort. Search by city name.
| Rank | City | Population | HHI | % White | % Black | % Hispanic | % Asian |
|---|---|---|---|---|---|---|---|
| 1 | Winooski | 8,293 | 6,101 | 76.9% | 3.2% | 2.5% | 12.8% |
| 2 | South Burlington | 20,756 | 6,259 | 78.2% | 1.8% | 3.5% | 10.2% |
| 3 | Middlebury | 7,220 | 6,452 | 79.6% | 1.6% | 5.3% | 6.8% |
| 4 | Burlington | 44,675 | 7,136 | 84.1% | 2.9% | 2.8% | 4.2% |
| 5 | Shelburne | 6,499 | 7,456 | 86.0% | 1.1% | 4.0% | 1.2% |
| 6 | Montpelier | 8,014 | 7,553 | 86.5% | 0.8% | 4.5% | 1.7% |
| 7 | St. Johnsbury | 5,859 | 7,878 | 88.5% | 0.9% | 1.6% | 0.3% |
| 8 | St. Albans | 6,954 | 7,998 | 89.2% | 0.4% | 1.5% | 2.5% |
| 9 | Bennington | 9,245 | 8,147 | 90.1% | 0.5% | 2.6% | 1.2% |
| 10 | Brattleboro | 7,657 | 8,459 | 91.9% | 1.1% | 4.1% | 0.9% |
| 11 | Barre | 8,412 | 8,516 | 92.2% | 0.1% | 1.5% | 2.6% |
| 12 | Rutland | 15,712 | 8,590 | 92.6% | 0.7% | 3.7% | 0.7% |
Source: U.S. Census ACS 2020-2024. 12 cities with more than 5,000 residents.
Summary
Summary: Diversity Across Vermont
If you’re looking for a scientific breakdown of diversity across Vermont, this is an accurate list.
The most diverse cities in Vermont are Winooski, South Burlington, Middlebury, Burlington, Shelburne, Montpelier, St. Johnsbury, St. Albans, Bennington, and Brattleboro.


