If you guessed that the Chicago area is home to Illinois’ most expensive places, you guessed right. The northeast corner of Illinois has a long history of exorbitant home prices, high property taxes, and people who can afford these premium price tags.
Before you head down to our list of Illinois’ top ten most expensive places, it’s important to note how we calculated our list. We used Saturday Night Science to compare the cost of living of the 330 Illinois places with at least 5,000 residents. Using American Community Survey data, we looked at home prices, rent, and income for each place.
If you want to know what it’s going to take to live in one of the most expensive places in one of the most costly states in America, take a look below.
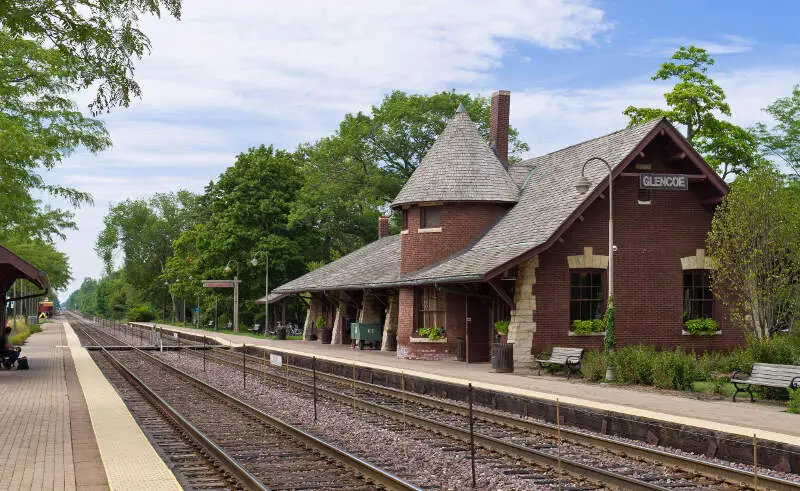
$248,933 median income · $1,577,965 median home · #2 home prices in Illinois
Glencoe is a village in northeastern Cook County, Illinois, United States. As of the 2010 census, the total population was 8,723. Glencoe is located on Chicago’s North Shore and is located within the New Trier High School District.
Data | Crime | Cost of living | Movers
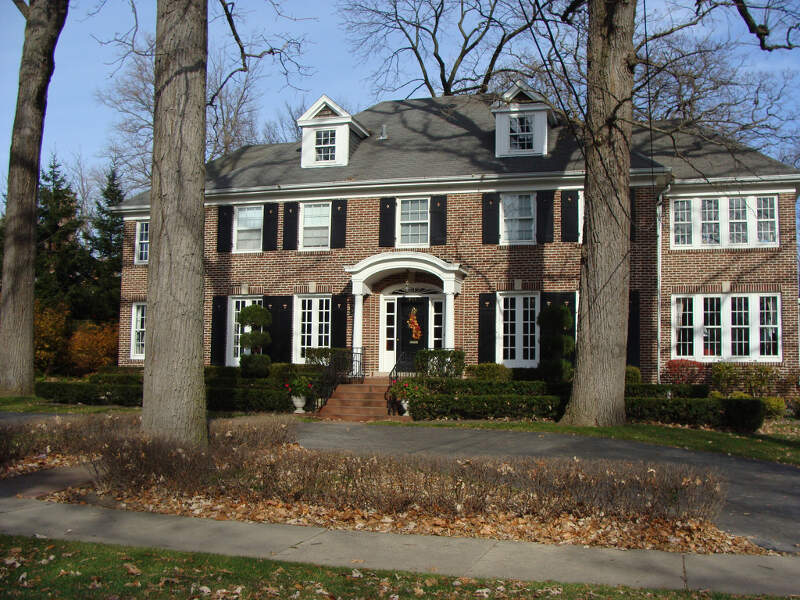
$250,001 median income · $1,818,305 median home · #1 home prices in Illinois
Winnetka is a village in Cook County, Illinois, United States, located 16 miles north of downtown Chicago. The population was 12,187 at the 2010 census. The village is one of the wealthiest places in the nation in terms of household income, and the richest in Illinois.
Data | Crime | Cost of living | Movers
$221,575 median income · $1,108,365 median home · #5 home prices in Illinois
Data | Crime | Cost of living | Movers
$175,870 median income · $966,776 median home · #6 home prices in Illinois
Oak Brook is an affluent village in DuPage County with a small portion in Cook County in Illinois. The population was 7,883 at the 2010 census. A suburb of Chicago, Oak Brook serves as home to the headquarters of several notable companies and organizations including McDonald’s, Ace Hardware, Blistex, Federal Signal, CenterPoint Properties, Sanford L.P., TreeHouse Foods, and Lions Clubs International.
Data | Crime | Cost of living | Movers
$250,001 median income · $1,244,308 median home · #3 home prices in Illinois
Data | Crime | Cost of living | Movers
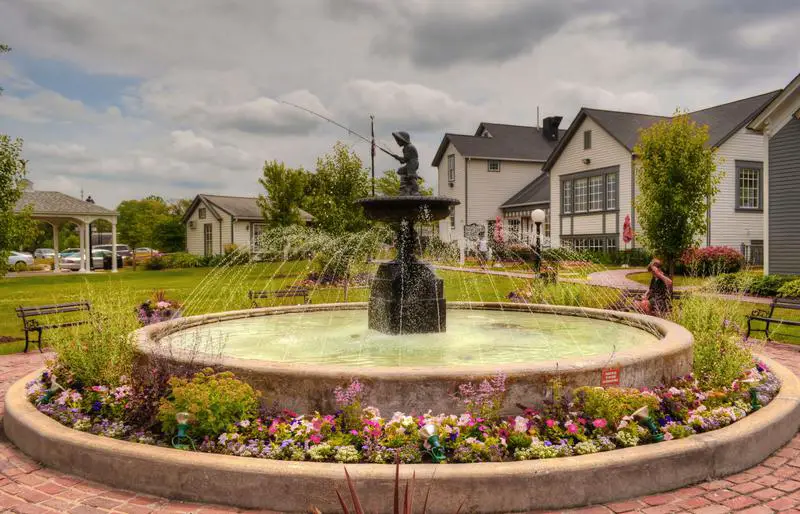
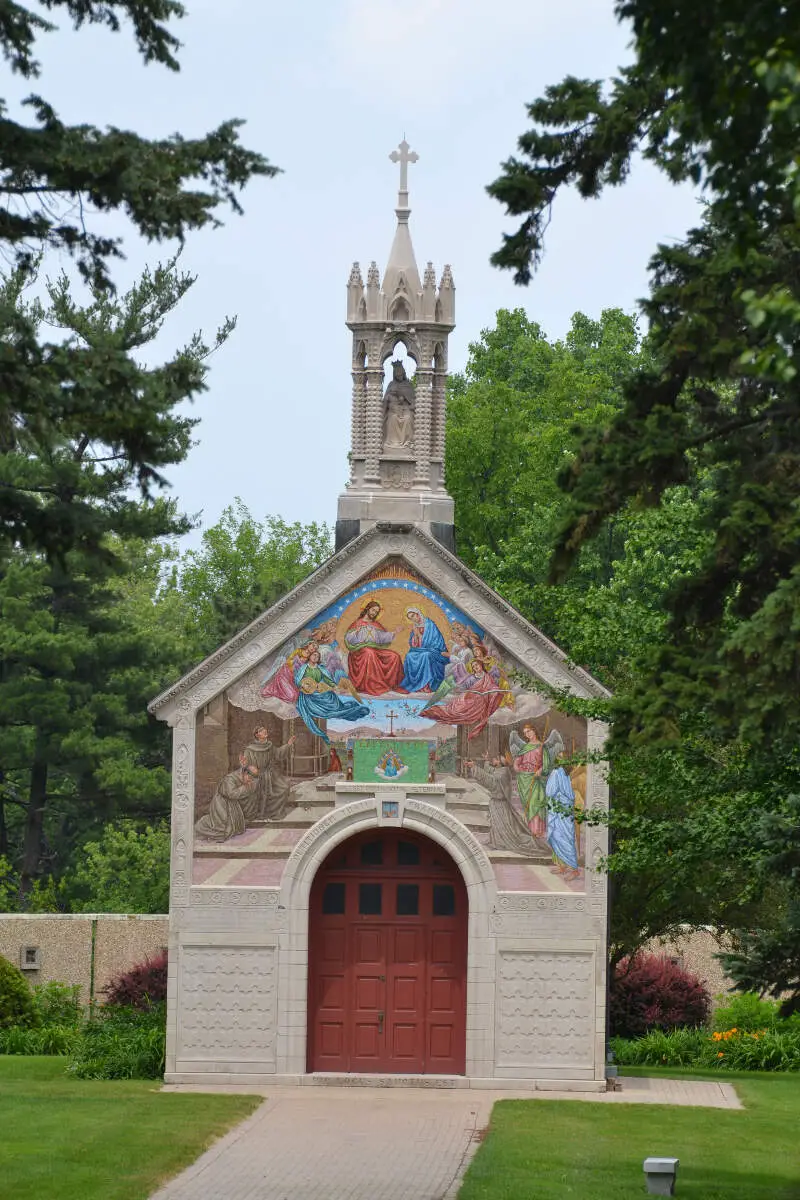
$250,001 median income · $924,481 median home · #8 home prices in Illinois
Long Grove is an affluent village in Lake County, Illinois, United States, approximately 35 miles northwest of Chicago. As of the 2010 census, the village had a population of 8,043. The village has strict building ordinances to preserve its “country atmosphere”.
Data | Crime | Cost of living | Movers
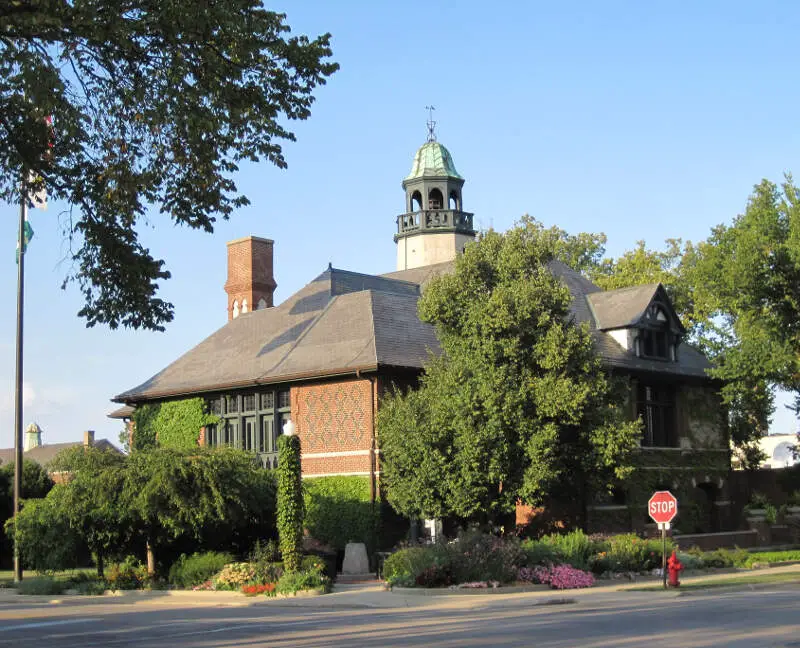
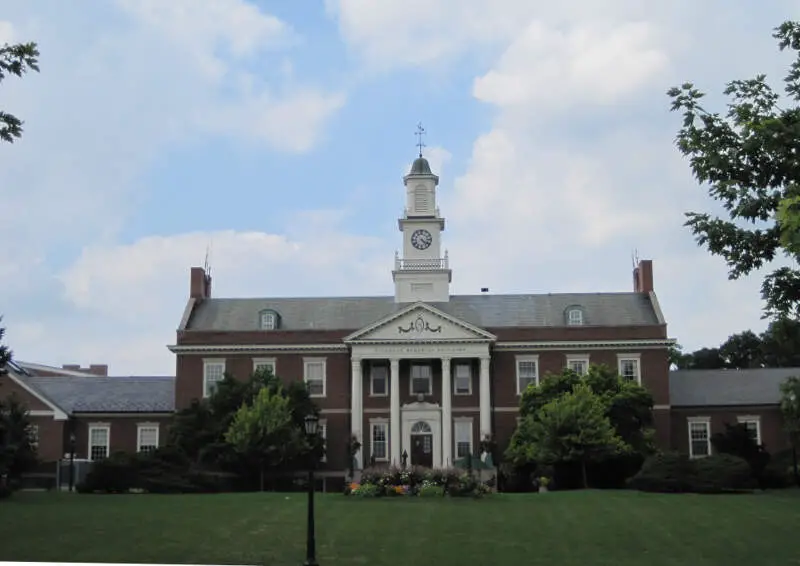
$235,081 median income · $1,167,578 median home · #4 home prices in Illinois
Lake Forest is a city located in Lake County, Illinois, United States. As of the 2010 census it had a population of 19,375. The city is along the shore of Lake Michigan, and is a part of the Chicago metropolitan area and the North Shore. Lake Forest was founded around Lake Forest College and was laid out as a town in 1857 as a stop for travelers making their way south to Chicago. The Lake Forest City Hall, designed by Charles Sumner Frost, was completed in 1898 and originally housed the fire department, the Lake Forest Library, and city offices. Lake Forest is among the wealthiest cities in the United States.
Data | Crime | Cost of living | Movers
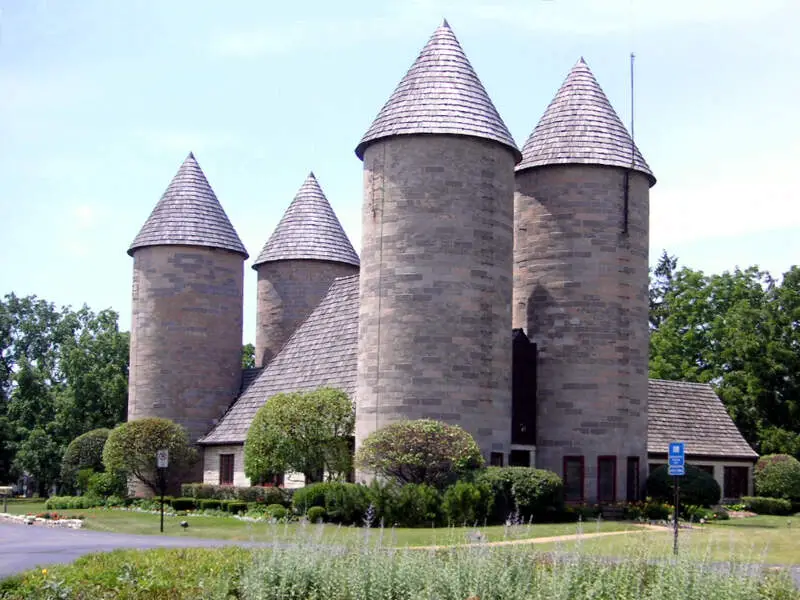
$207,434 median income · $787,210 median home · #12 home prices in Illinois
Inverness is a suburban village in Cook County, Illinois, United States. The population was 7,399 at the 2010 census.
Data | Crime | Cost of living | Movers
$161,500 median income · $841,446 median home · #10 home prices in Illinois
Northfield is an affluent village in Cook County, Illinois, United States, located approximately 19 miles north of downtown Chicago. It is part of a collection of upscale residential communities north of Chicago that belong to New Trier Township and the greater North Shore. As of the 2010 census, the village’s population was 5,420.
Data | Crime | Cost of living | Movers
$156,829 median income · $828,471 median home · #11 home prices in Illinois
Burr Ridge is a suburb of Chicago, in Cook and DuPage counties, Illinois, United States. The village is listed among the top wealthiest towns in Illinois and is locally known for its large beautiful residences. The population was 10,559 at the 2010 census.
Data | Crime | Cost of living | Movers
The receipts
Compare the top ten
Pick a metric. The bars rescale. The red line is Illinois’s statewide median.
Illinois statewide median: $285,736
Illinois statewide median: $83,390
On the map
Mapping the most expensive places in Illinois
Saturday Night Science
Methodology: How We Determined The Most Expensive Places To Live In The Prairie State For 2026
The two most important things to think about when it comes to being able to afford a city in Illinois are how much money you make and how much you have to spend to live there.
You need to understand your costs in the context of how much money you make.
For example, if the median household earns $100,000 and spends $40,000 on housing, it’s actually cheaper to live there than a place with a median income of $50,000 and housing costs of $21,000. You might spend more on housing, but you have more money overall to play with.
With that example in mind, we derived several statistics from the latest Census American Community Survey 2020-2024 around incomes and costs. They are:
- Overall Cost Of Living Index
- Median Home Price / Median Income (lower is better)
- Median Income / Median Rent (Higher is better)
- Median Home Price
You can then compare these metrics in each of the places in Illinois to figure out which is the most expensive.
You are left with a “Cost of Living Index” by taking the average rank of each of these metrics for each city.
So we used that cost of living index to rank all of the 330 places in Illinois that have more than 5,000 people.
The place with the highest cost of living in Illinois according to the data is Glencoe. We updated this article for 2026. This article is our eleventh time ranking the most expensive places to live in Illinois.
The full plate
Most Expensive Cities In Illinois
Click any column to sort. Search by city name.
| Rank | City | Cost Of Living | Population | Median Income | Average Home Price | Home/Income Ratio |
|---|---|---|---|---|---|---|
| 1 | Glencoe | 240 | 8,701 | $248,933 | $1,577,965 | 6.3x |
| 2 | Winnetka | 216 | 12,484 | $250,001 | $1,818,305 | 7.3x |
| 3 | South Barrington | 210 | 5,021 | $221,575 | $1,108,365 | 5.0x |
| 4 | Oak Brook | 201 | 8,056 | $175,870 | $966,776 | 5.5x |
| 5 | Hinsdale | 191 | 17,175 | $250,001 | $1,244,308 | 5.0x |
| 6 | Long Grove | 182 | 8,305 | $250,001 | $924,481 | 3.7x |
| 7 | Lake Forest | 180 | 19,416 | $235,081 | $1,167,578 | 5.0x |
| 8 | Inverness | 178 | 7,275 | $207,434 | $787,210 | 3.8x |
| 9 | Northfield | 175 | 5,487 | $161,500 | $841,446 | 5.2x |
| 10 | Burr Ridge | 168 | 11,141 | $156,829 | $828,471 | 5.3x |
| 11 | Hawthorn Woods | 167 | 9,143 | $219,631 | $727,356 | 3.3x |
| 12 | Lake Bluff | 167 | 6,041 | $204,000 | $633,530 | 3.1x |
| 13 | Wilmette | 161 | 27,503 | $190,662 | $961,183 | 5.0x |
| 14 | Lincolnshire | 161 | 7,980 | $185,580 | $714,055 | 3.8x |
| 15 | Western Springs | 156 | 13,446 | $230,255 | $863,783 | 3.8x |
| 16 | Northbrook | 151 | 34,585 | $157,782 | $688,265 | 4.4x |
| 17 | River Forest | 151 | 11,992 | $146,786 | $716,652 | 4.9x |
| 18 | Deerfield | 148 | 19,518 | $181,660 | $635,444 | 3.5x |
| 19 | Glenview | 146 | 47,752 | $143,056 | $663,147 | 4.6x |
| 20 | Highland Park | 144 | 30,398 | $168,094 | $751,001 | 4.5x |
| 21 | La Grange | 143 | 15,998 | $159,929 | $639,655 | 4.0x |
| 22 | Campton Hills | 143 | 10,877 | $209,134 | $666,624 | 3.2x |
| 23 | Barrington | 138 | 11,077 | $147,989 | $613,360 | 4.1x |
| 24 | Glen Ellyn | 137 | 28,390 | $140,938 | $562,204 | 4.0x |
| 25 | Lincolnwood | 136 | 13,112 | $109,731 | $542,075 | 4.9x |
| 26 | Park Ridge | 135 | 38,667 | $142,986 | $564,905 | 4.0x |
| 27 | Elmhurst | 134 | 45,671 | $149,644 | $613,207 | 4.1x |
| 28 | Naperville | 133 | 150,692 | $155,105 | $610,454 | 3.9x |
| 29 | Libertyville | 133 | 20,525 | $165,667 | $603,285 | 3.6x |
| 30 | Clarendon Hills | 133 | 8,659 | $130,388 | $666,351 | 5.1x |
| 31 | Frankfort | 130 | 20,651 | $154,375 | $487,132 | 3.2x |
| 32 | Evanston | 129 | 76,340 | $96,434 | $470,774 | 4.9x |
| 33 | Riverside | 129 | 9,039 | $153,686 | $547,998 | 3.6x |
| 34 | Morton Grove | 128 | 24,619 | $111,116 | $430,051 | 3.9x |
| 35 | Winfield | 128 | 10,095 | $135,795 | $456,207 | 3.4x |
| 36 | Wheaton | 127 | 53,557 | $120,008 | $501,273 | 4.2x |
| 37 | Plainfield | 126 | 46,708 | $144,000 | $421,481 | 2.9x |
| 38 | Buffalo Grove | 126 | 42,891 | $129,395 | $436,990 | 3.4x |
| 39 | Vernon Hills | 126 | 26,876 | $121,943 | $448,031 | 3.7x |
| 40 | Geneva | 126 | 21,258 | $144,341 | $532,206 | 3.7x |
| 41 | Lake Barrington | 126 | 5,442 | $141,958 | $534,063 | 3.8x |
| 42 | Highwood | 126 | 5,301 | $107,875 | $467,497 | 4.3x |
| 43 | Arlington Heights | 125 | 76,005 | $116,723 | $470,945 | 4.0x |
| 44 | Oak Park | 125 | 53,292 | $110,820 | $458,455 | 4.1x |
| 45 | Spring Grove | 125 | 5,917 | $134,210 | $406,655 | 3.0x |
| 46 | Downers Grove | 124 | 50,054 | $115,114 | $494,151 | 4.3x |
| 47 | Itasca | 124 | 9,355 | $114,294 | $443,025 | 3.9x |
| 48 | Lemont | 123 | 17,820 | $123,370 | $565,404 | 4.6x |
| 49 | La Grange Park | 123 | 13,447 | $120,408 | $480,916 | 4.0x |
| 50 | Lisle | 122 | 23,407 | $107,479 | $425,025 | 4.0x |
| 51 | Lake Zurich | 122 | 19,832 | $135,968 | $488,103 | 3.6x |
| 52 | Mount Prospect | 121 | 55,472 | $101,720 | $433,814 | 4.3x |
| 53 | Homer Glen | 121 | 24,529 | $136,678 | $505,179 | 3.7x |
| 54 | Flossmoor | 121 | 9,391 | $133,663 | $327,346 | 2.4x |
| 55 | Bloomingdale | 120 | 22,457 | $102,928 | $428,844 | 4.2x |
| 56 | Darien | 120 | 21,879 | $111,215 | $449,623 | 4.0x |
| 57 | Shorewood | 120 | 18,343 | $122,105 | $403,278 | 3.3x |
| 58 | Palos Heights | 120 | 12,152 | $108,740 | $389,153 | 3.6x |
| 59 | Gilberts | 120 | 8,606 | $146,333 | $409,641 | 2.8x |
| 60 | Bartlett | 119 | 40,501 | $133,240 | $430,326 | 3.2x |
| 61 | Willow Springs | 119 | 5,868 | $103,583 | $386,669 | 3.7x |
| 62 | Skokie | 118 | 66,219 | $95,337 | $413,078 | 4.3x |
| 63 | Hoffman Estates | 118 | 51,175 | $106,806 | $394,618 | 3.7x |
| 64 | St. Charles | 118 | 32,854 | $114,300 | $463,142 | 4.1x |
| 65 | Batavia | 118 | 27,151 | $120,056 | $453,319 | 3.8x |
| 66 | Sugar Grove | 118 | 9,240 | $121,207 | $445,737 | 3.7x |
| 67 | Willowbrook | 118 | 9,131 | $99,239 | $322,190 | 3.2x |
| 68 | Johnsburg | 118 | 6,386 | $121,023 | $393,344 | 3.3x |
| 69 | Lombard | 117 | 43,619 | $100,362 | $380,912 | 3.8x |
| 70 | Algonquin | 117 | 30,067 | $134,525 | $406,940 | 3.0x |
| 71 | Mokena | 117 | 20,021 | $123,889 | $443,959 | 3.6x |
| 72 | Norridge | 117 | 15,439 | $87,807 | $405,485 | 4.6x |
| 73 | Woodridge | 116 | 33,941 | $101,000 | $404,092 | 4.0x |
| 74 | Elk Grove Village | 116 | 31,987 | $94,175 | $383,810 | 4.1x |
| 75 | Elburn | 116 | 6,354 | $127,731 | $448,721 | 3.5x |
| 76 | Schaumburg | 115 | 76,868 | $97,514 | $349,953 | 3.6x |
| 77 | New Lenox | 115 | 28,006 | $140,865 | $440,656 | 3.1x |
| 78 | Westmont | 115 | 23,724 | $88,090 | $400,412 | 4.5x |
| 79 | Prospect Heights | 115 | 15,618 | $85,008 | $366,446 | 4.3x |
| 80 | Pingree Grove | 115 | 10,914 | $114,294 | $369,702 | 3.2x |
| 81 | Hampshire | 115 | 8,524 | $94,773 | $407,967 | 4.3x |
| 82 | West Dundee | 115 | 7,906 | $105,368 | $411,113 | 3.9x |
| 83 | Chicago | 114 | 2,711,226 | $77,902 | $317,283 | 4.1x |
| 84 | Orland Park | 114 | 57,916 | $98,910 | $397,472 | 4.0x |
| 85 | Niles | 114 | 30,064 | $75,274 | $399,810 | 5.3x |
| 86 | Westchester | 114 | 16,436 | $98,954 | $357,237 | 3.6x |
| 87 | Palatine | 113 | 66,293 | $97,819 | $375,855 | 3.8x |
| 88 | Lake in the Hills | 113 | 28,800 | $117,151 | $369,917 | 3.2x |
| 89 | South Elgin | 113 | 24,217 | $127,203 | $366,632 | 2.9x |
| 90 | Rolling Meadows | 113 | 24,027 | $98,514 | $322,644 | 3.3x |
| 91 | Yorkville | 113 | 23,617 | $108,513 | $399,862 | 3.7x |
| 92 | Minooka | 113 | 12,891 | $115,445 | $364,409 | 3.2x |
| 93 | Lake Villa | 113 | 8,683 | $118,750 | $370,654 | 3.1x |
| 94 | Carol Stream | 112 | 39,460 | $102,309 | $377,328 | 3.7x |
| 95 | Oswego | 112 | 36,375 | $123,792 | $416,738 | 3.4x |
| 96 | Elmwood Park | 112 | 23,868 | $91,955 | $338,383 | 3.7x |
| 97 | Roselle | 112 | 22,752 | $111,318 | $374,678 | 3.4x |
| 98 | Villa Park | 112 | 22,345 | $95,015 | $354,427 | 3.7x |
| 99 | Wood Dale | 112 | 13,933 | $91,382 | $347,554 | 3.8x |
| 100 | North Riverside | 112 | 7,249 | $77,170 | $340,577 | 4.4x |
Source: U.S. Census ACS 2020-2024, Zillow research. 330 places with more than 5,000 residents.
Summary
Summary: Taking A Chunk Out Of Your Paycheck In Illinois For 2026
Well, there you have it, the places in Illinois that have the highest cost of living, with Glencoe ranking as the most expensive city in the Prairie State.
The most expensive cities in Illinois are Glencoe, Winnetka, South Barrington, Oak Brook, Hinsdale, Long Grove, Lake Forest, Inverness, Northfield, and Burr Ridge.


