
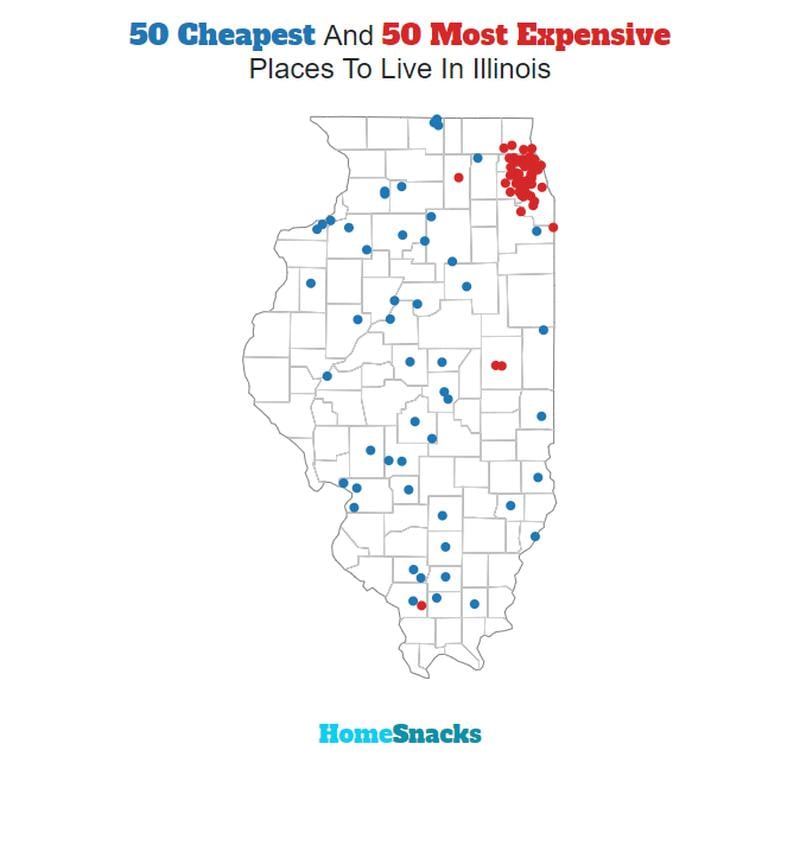
If you guessed that the Chicago area is home to Illinois’ most expensive places, you guessed right. The northeast corner of Illinois has a long history of exorbitant home prices, high property taxes, and people who can afford these premium price tags.
Before you head down to our list of Illinois’ top ten most expensive places, it’s important to note how we calculated our list. We used Saturday Night Science to compare the cost of living of the 330 Illinois places with at least 5,000 residents. Using American Community Survey data, we looked at home prices, rent, and income for each place.
If you want to know what it’s going to take to live in one of the most expensive places in one of the most costly states in America, take a look below.
Table Of Contents: Top Ten | Methodology | Summary | Table
The 10 Most Expensive Places To Live In Illinois For 2026
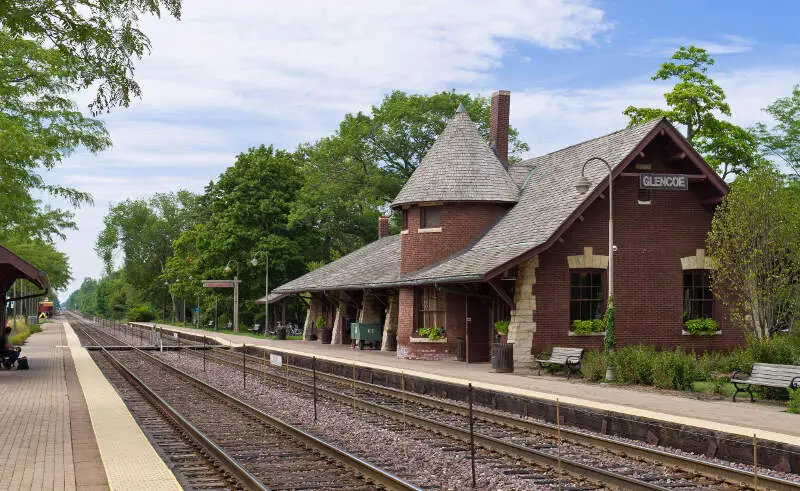
What’s the most expensive place to live in Illinois? Well, HomeSnacks crunched the numbers and discovered that Glencoe is the most expensive place to live in Illinois.
East St. Louis (the cheapest place to live in Illinois) can show these guys how to live on a budget in the coming years. Read on for how these places had costs rise faster than inflation.
And if you already knew these places were expensive, check out some more reading about Illinois and the most expensive cities in the country:
The 10 Most Expensive Places To Live In Illinois For 2026

/10
Population: 8,701
Cost Of Living Index: 240
Median Income: $248,933
Average Home Price: $1,577,964
Home Price To Income Ratio: 6.3x
More on Glencoe: Data | Crime | Cost Of Living | Movers
The overall cost of living in Glencoe is 240. The median income in Glencoe comes in at $248,933 and the average home value is $1,577,964 for 2026.

/10
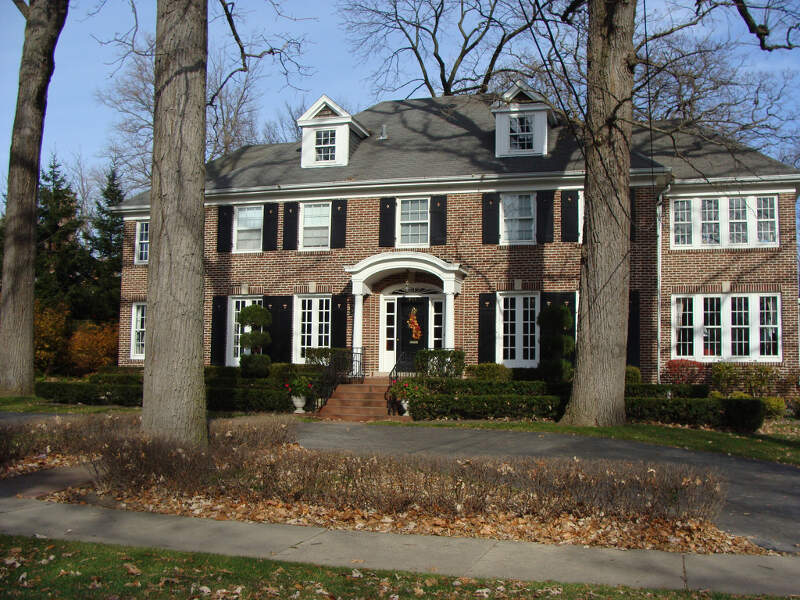
Population: 12,484
Cost Of Living Index: 216
Median Income: $250,001
Average Home Price: $1,818,304
Home Price To Income Ratio: 7.3x
More on Winnetka: Data | Crime | Cost Of Living | Movers
The overall cost of living in Winnetka is 216. The median income in Winnetka comes in at $250,001 and the average home value is $1,818,304 for 2026.
/10
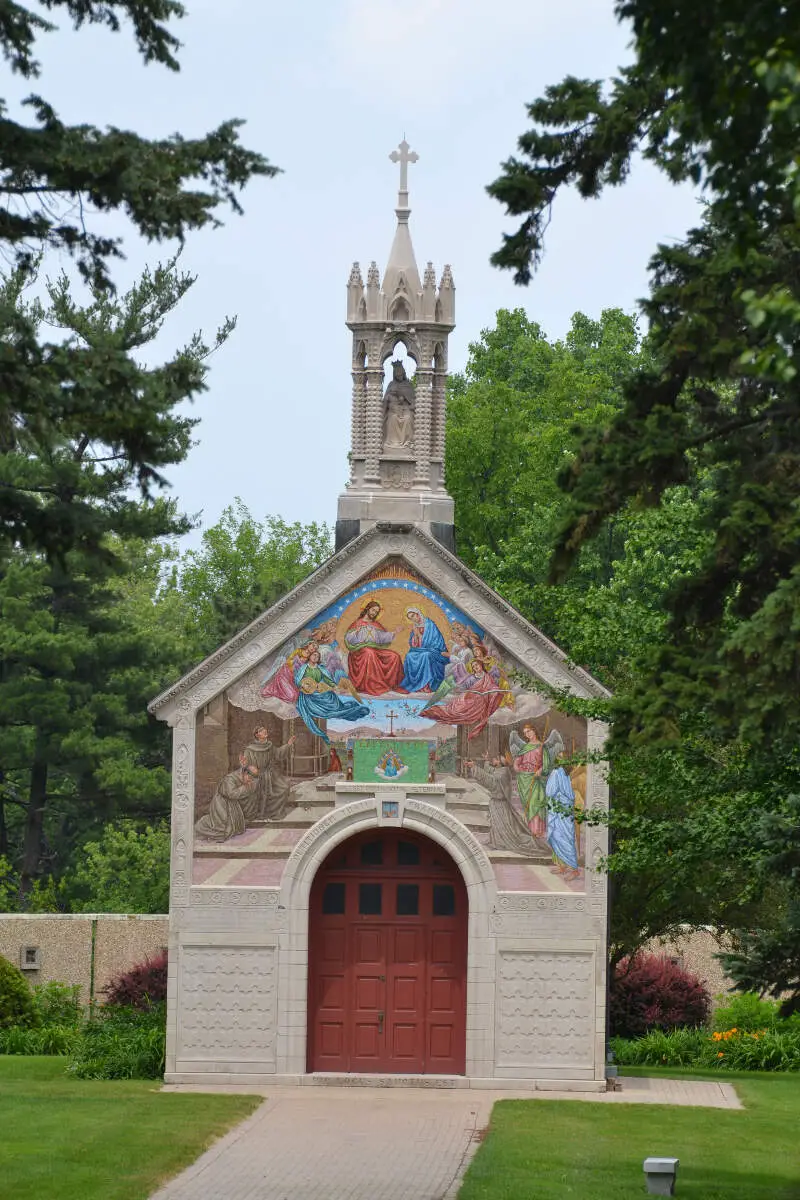
The overall cost of living in South Barrington is 210. The median income in South Barrington comes in at $221,575 and the average home value is $1,108,364 for 2026.

/10
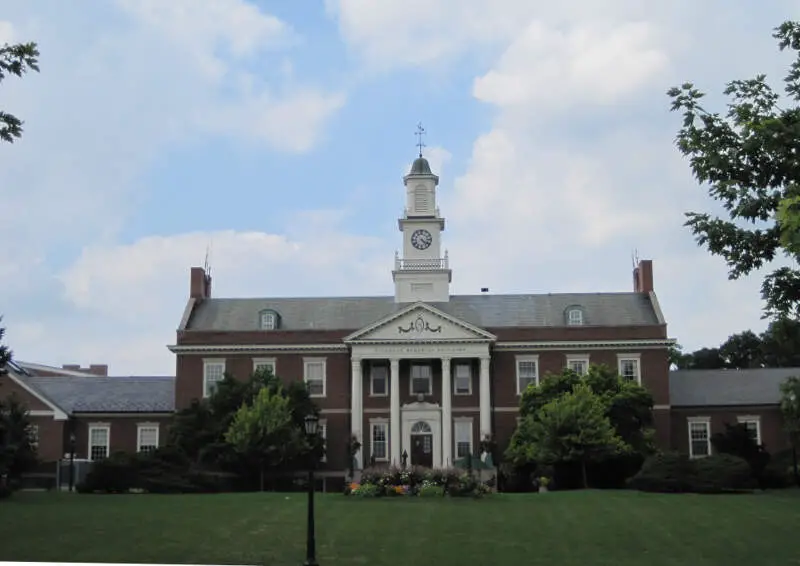
Population: 8,056
Cost Of Living Index: 201
Median Income: $175,870
Average Home Price: $966,776
Home Price To Income Ratio: 5.5x
More on Oak Brook: Data | Crime | Cost Of Living | Movers
The overall cost of living in Oak Brook is 201. The median income in Oak Brook comes in at $175,870 and the average home value is $966,776 for 2026.

/10
Population: 17,175
Cost Of Living Index: 191
Median Income: $250,001
Average Home Price: $1,244,308
Home Price To Income Ratio: 5.0x
More on Hinsdale: Data | Crime | Cost Of Living | Movers
The overall cost of living in Hinsdale is 191. The median income in Hinsdale comes in at $250,001 and the average home value is $1,244,308 for 2026.

/10
Population: 8,305
Cost Of Living Index: 182
Median Income: $250,001
Average Home Price: $924,480
Home Price To Income Ratio: 3.7x
More on Long Grove: Data | Cost Of Living | Movers
The overall cost of living in Long Grove is 182. The median income in Long Grove comes in at $250,001 and the average home value is $924,480 for 2026.

/10
Population: 19,416
Cost Of Living Index: 180
Median Income: $235,081
Average Home Price: $1,167,578
Home Price To Income Ratio: 5.0x
More on Lake Forest: Data | Crime | Cost Of Living | Movers
The overall cost of living in Lake Forest is 180. The median income in Lake Forest comes in at $235,081 and the average home value is $1,167,578 for 2026.

/10
Population: 7,275
Cost Of Living Index: 178
Median Income: $207,434
Average Home Price: $787,209
Home Price To Income Ratio: 3.8x
More on Inverness: Data | Crime | Cost Of Living | Movers
The overall cost of living in Inverness is 178. The median income in Inverness comes in at $207,434 and the average home value is $787,209 for 2026.
/10
Population: 5,487
Cost Of Living Index: 175
Median Income: $161,500
Average Home Price: $841,445
Home Price To Income Ratio: 5.2x
More on Northfield: Data | Crime | Cost Of Living | Movers
The overall cost of living in Northfield is 175. The median income in Northfield comes in at $161,500 and the average home value is $841,445 for 2026.

/10
Population: 11,141
Cost Of Living Index: 168
Median Income: $156,829
Average Home Price: $828,471
Home Price To Income Ratio: 5.3x
More on Burr Ridge: Data | Crime | Cost Of Living | Movers
The overall cost of living in Burr Ridge is 168. The median income in Burr Ridge comes in at $156,829 and the average home value is $828,471 for 2026.
Methodology: How We Determined The Most Expensive Places To Live In The Prairie State For 2026
The two most important things to think about when it comes to being able to afford a city in Illinois are:
- How much money do I make?
- How much do I have to spend to live there?
You need to understand your costs in the context of how much money you make.
For example, if the median household earns $100,000 and spends $40,000 on housing, it’s actually cheaper to live there than a place with a median income of $50,000 and housing costs of $21,000. You might spend more on housing, but you have more money overall to play with.
With that example in mind, we derived several statistics from the latest Census American Community Survey 2020-2024 around incomes and costs. They are:
- Overall Cost Of Living Index
- Median Home Price / Median Income (lower is better)
- Median Income / Median Rent (Higher is better)
- Median Home Price
You can then compare these metrics in each of the places in Illinois to figure out which is the most expensive.
You are left with a “Cost of Living Index” by taking the average rank of each of these metrics for each city.
So we used that cost of living index to rank all of the 330 places in Illinois that have more than 5,000 people.
The place with the highest cost of living in Illinois according to the data is Glencoe. We updated this article for 2026. This article is our eleventh time ranking the most expensive places to live in Illinois.
Summary: Taking A Chunk Out Of Your Paycheck In Illinois For 2026
Well, there you have it, the places in Illinois that have the highest cost of living, with Glencoe ranking as the most expensive city in the Prairie State.
The most expensive cities in Illinois are Glencoe, Winnetka, South Barrington, Oak Brook, Hinsdale, Long Grove, Lake Forest, Inverness, Northfield, and Burr Ridge.
Here’s a look at the most affordable cities in Illinois according to the data:
- East St. Louis
- Hoopeston
- Du Quoin
For more Illinois reading, check out:
- Best Places To Live In Illinois
- Cheapest Places To Live In Illinois
- Most Dangerous Cities In Illinois
- Best Places To Raise A Family In Illinois
- Safest Places In Illinois
- Worst Places To Live In Illinois
Most Expensive Cities In Illinois
| Rank | City | Cost Of Living | Population | Median Income | Average Home Price | Home/Income Ratio |
|---|---|---|---|---|---|---|
| 1 | Glencoe | 240 | 8,701 | $248,933 | $1,577,964 | 6.3x |
| 2 | Winnetka | 216 | 12,484 | $250,001 | $1,818,304 | 7.3x |
| 3 | South Barrington | 210 | 5,021 | $221,575 | $1,108,364 | 5.0x |
| 4 | Oak Brook | 201 | 8,056 | $175,870 | $966,776 | 5.5x |
| 5 | Hinsdale | 191 | 17,175 | $250,001 | $1,244,308 | 5.0x |
| 6 | Long Grove | 182 | 8,305 | $250,001 | $924,480 | 3.7x |
| 7 | Lake Forest | 180 | 19,416 | $235,081 | $1,167,578 | 5.0x |
| 8 | Inverness | 178 | 7,275 | $207,434 | $787,209 | 3.8x |
| 9 | Northfield | 175 | 5,487 | $161,500 | $841,445 | 5.2x |
| 10 | Burr Ridge | 168 | 11,141 | $156,829 | $828,471 | 5.3x |
| 11 | Hawthorn Woods | 167 | 9,143 | $219,631 | $727,355 | 3.3x |
| 12 | Lake Bluff | 167 | 6,041 | $204,000 | $633,529 | 3.1x |
| 13 | Wilmette | 161 | 27,503 | $190,662 | $961,182 | 5.0x |
| 14 | Lincolnshire | 161 | 7,980 | $185,580 | $714,055 | 3.8x |
| 15 | Western Springs | 156 | 13,446 | $230,255 | $863,782 | 3.8x |
| 16 | Northbrook | 151 | 34,585 | $157,782 | $688,265 | 4.4x |
| 17 | River Forest | 151 | 11,992 | $146,786 | $716,652 | 4.9x |
| 18 | Deerfield | 148 | 19,518 | $181,660 | $635,444 | 3.5x |
| 19 | Glenview | 146 | 47,752 | $143,056 | $663,146 | 4.6x |
| 20 | Highland Park | 144 | 30,398 | $168,094 | $751,000 | 4.5x |
| 21 | La Grange | 143 | 15,998 | $159,929 | $639,654 | 4.0x |
| 22 | Campton Hills | 143 | 10,877 | $209,134 | $666,624 | 3.2x |
| 23 | Barrington | 138 | 11,077 | $147,989 | $613,360 | 4.1x |
| 24 | Glen Ellyn | 137 | 28,390 | $140,938 | $562,204 | 4.0x |
| 25 | Lincolnwood | 136 | 13,112 | $109,731 | $542,075 | 4.9x |
| 26 | Park Ridge | 135 | 38,667 | $142,986 | $564,904 | 4.0x |
| 27 | Elmhurst | 134 | 45,671 | $149,644 | $613,207 | 4.1x |
| 28 | Naperville | 133 | 150,692 | $155,105 | $610,453 | 3.9x |
| 29 | Libertyville | 133 | 20,525 | $165,667 | $603,285 | 3.6x |
| 30 | Clarendon Hills | 133 | 8,659 | $130,388 | $666,350 | 5.1x |
| 31 | Frankfort | 130 | 20,651 | $154,375 | $487,132 | 3.2x |
| 32 | Evanston | 129 | 76,340 | $96,434 | $470,774 | 4.9x |
| 33 | Riverside | 129 | 9,039 | $153,686 | $547,998 | 3.6x |
| 34 | Morton Grove | 128 | 24,619 | $111,116 | $430,051 | 3.9x |
| 35 | Winfield | 128 | 10,095 | $135,795 | $456,206 | 3.4x |
| 36 | Wheaton | 127 | 53,557 | $120,008 | $501,273 | 4.2x |
| 37 | Plainfield | 126 | 46,708 | $144,000 | $421,480 | 2.9x |
| 38 | Buffalo Grove | 126 | 42,891 | $129,395 | $436,990 | 3.4x |
| 39 | Vernon Hills | 126 | 26,876 | $121,943 | $448,031 | 3.7x |
| 40 | Geneva | 126 | 21,258 | $144,341 | $532,206 | 3.7x |
| 41 | Lake Barrington | 126 | 5,442 | $141,958 | $534,062 | 3.8x |
| 42 | Highwood | 126 | 5,301 | $107,875 | $467,497 | 4.3x |
| 43 | Arlington Heights | 125 | 76,005 | $116,723 | $470,944 | 4.0x |
| 44 | Oak Park | 125 | 53,292 | $110,820 | $458,455 | 4.1x |
| 45 | Spring Grove | 125 | 5,917 | $134,210 | $406,655 | 3.0x |
| 46 | Downers Grove | 124 | 50,054 | $115,114 | $494,150 | 4.3x |
| 47 | Itasca | 124 | 9,355 | $114,294 | $443,025 | 3.9x |
| 48 | Lemont | 123 | 17,820 | $123,370 | $565,404 | 4.6x |
| 49 | La Grange Park | 123 | 13,447 | $120,408 | $480,916 | 4.0x |
| 50 | Lisle | 122 | 23,407 | $107,479 | $425,025 | 4.0x |
| 51 | Lake Zurich | 122 | 19,832 | $135,968 | $488,102 | 3.6x |
| 52 | Mount Prospect | 121 | 55,472 | $101,720 | $433,813 | 4.3x |
| 53 | Homer Glen | 121 | 24,529 | $136,678 | $505,178 | 3.7x |
| 54 | Flossmoor | 121 | 9,391 | $133,663 | $327,345 | 2.4x |
| 55 | Bloomingdale | 120 | 22,457 | $102,928 | $428,844 | 4.2x |
| 56 | Darien | 120 | 21,879 | $111,215 | $449,622 | 4.0x |
| 57 | Shorewood | 120 | 18,343 | $122,105 | $403,277 | 3.3x |
| 58 | Palos Heights | 120 | 12,152 | $108,740 | $389,152 | 3.6x |
| 59 | Gilberts | 120 | 8,606 | $146,333 | $409,640 | 2.8x |
| 60 | Bartlett | 119 | 40,501 | $133,240 | $430,325 | 3.2x |
| 61 | Willow Springs | 119 | 5,868 | $103,583 | $386,669 | 3.7x |
| 62 | Skokie | 118 | 66,219 | $95,337 | $413,077 | 4.3x |
| 63 | Hoffman Estates | 118 | 51,175 | $106,806 | $394,617 | 3.7x |
| 64 | St. Charles | 118 | 32,854 | $114,300 | $463,142 | 4.1x |
| 65 | Batavia | 118 | 27,151 | $120,056 | $453,319 | 3.8x |
| 66 | Sugar Grove | 118 | 9,240 | $121,207 | $445,736 | 3.7x |
| 67 | Willowbrook | 118 | 9,131 | $99,239 | $322,189 | 3.2x |
| 68 | Johnsburg | 118 | 6,386 | $121,023 | $393,344 | 3.3x |
| 69 | Lombard | 117 | 43,619 | $100,362 | $380,912 | 3.8x |
| 70 | Algonquin | 117 | 30,067 | $134,525 | $406,940 | 3.0x |
| 71 | Mokena | 117 | 20,021 | $123,889 | $443,959 | 3.6x |
| 72 | Norridge | 117 | 15,439 | $87,807 | $405,484 | 4.6x |
| 73 | Woodridge | 116 | 33,941 | $101,000 | $404,091 | 4.0x |
| 74 | Elk Grove Village | 116 | 31,987 | $94,175 | $383,809 | 4.1x |
| 75 | Elburn | 116 | 6,354 | $127,731 | $448,721 | 3.5x |
| 76 | Schaumburg | 115 | 76,868 | $97,514 | $349,953 | 3.6x |
| 77 | New Lenox | 115 | 28,006 | $140,865 | $440,655 | 3.1x |
| 78 | Westmont | 115 | 23,724 | $88,090 | $400,411 | 4.5x |
| 79 | Prospect Heights | 115 | 15,618 | $85,008 | $366,445 | 4.3x |
| 80 | Pingree Grove | 115 | 10,914 | $114,294 | $369,701 | 3.2x |
| 81 | Hampshire | 115 | 8,524 | $94,773 | $407,966 | 4.3x |
| 82 | West Dundee | 115 | 7,906 | $105,368 | $411,112 | 3.9x |
| 83 | Chicago | 114 | 2,711,226 | $77,902 | $317,282 | 4.1x |
| 84 | Orland Park | 114 | 57,916 | $98,910 | $397,472 | 4.0x |
| 85 | Niles | 114 | 30,064 | $75,274 | $399,809 | 5.3x |
| 86 | Westchester | 114 | 16,436 | $98,954 | $357,237 | 3.6x |
| 87 | Palatine | 113 | 66,293 | $97,819 | $375,854 | 3.8x |
| 88 | Lake in the Hills | 113 | 28,800 | $117,151 | $369,917 | 3.2x |
| 89 | South Elgin | 113 | 24,217 | $127,203 | $366,631 | 2.9x |
| 90 | Rolling Meadows | 113 | 24,027 | $98,514 | $322,644 | 3.3x |
| 91 | Yorkville | 113 | 23,617 | $108,513 | $399,862 | 3.7x |
| 92 | Minooka | 113 | 12,891 | $115,445 | $364,409 | 3.2x |
| 93 | Lake Villa | 113 | 8,683 | $118,750 | $370,653 | 3.1x |
| 94 | Carol Stream | 112 | 39,460 | $102,309 | $377,327 | 3.7x |
| 95 | Oswego | 112 | 36,375 | $123,792 | $416,737 | 3.4x |
| 96 | Elmwood Park | 112 | 23,868 | $91,955 | $338,383 | 3.7x |
| 97 | Roselle | 112 | 22,752 | $111,318 | $374,677 | 3.4x |
| 98 | Villa Park | 112 | 22,345 | $95,015 | $354,426 | 3.7x |
| 99 | Wood Dale | 112 | 13,933 | $91,382 | $347,553 | 3.8x |
| 100 | North Riverside | 112 | 7,249 | $77,170 | $340,576 | 4.4x |