Before you decide to relocate to New Jersey, it’s important to research the exact cost of living around the state. And that’s what we’re going to help you do.
These are the places in New Jersey that cost a pretty penny — the most expensive cities in the state.
We used Saturday Night Science to compare the 2020-2024 American Community Survey on cost of living for the 262 places in New Jersey with more than 5,000 people.
After we saved up for months and could finally afford it, we landed on this list of the ten most expensive cities in New Jersey for 2026.
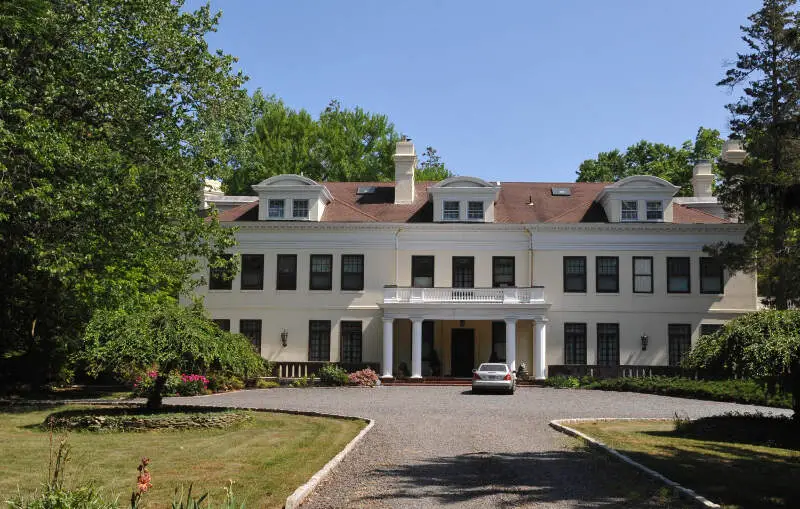
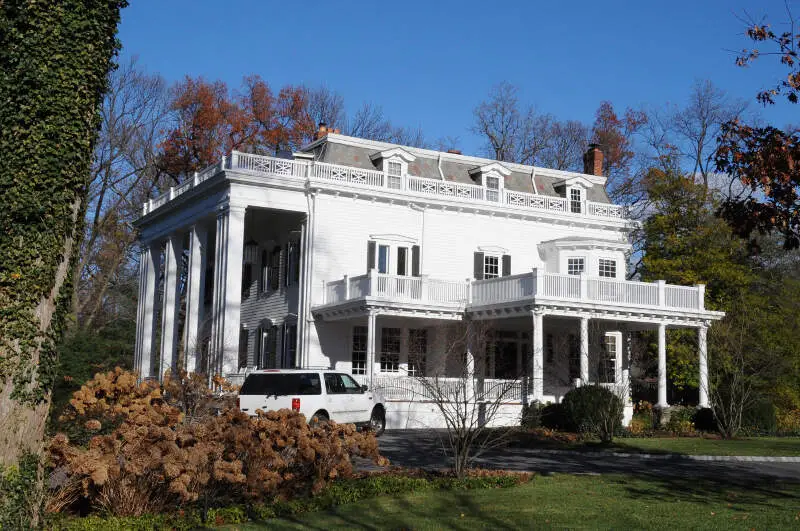
$250,001 median income · $2,309,383 median home · #1 home prices in New Jersey
Short Hills is an unincorporated community and census-designated place located within Millburn Township, in Essex County, New Jersey, United States. It is a popular commuter town for residents who work in New York City.
Data | Crime | Cost of living | Movers
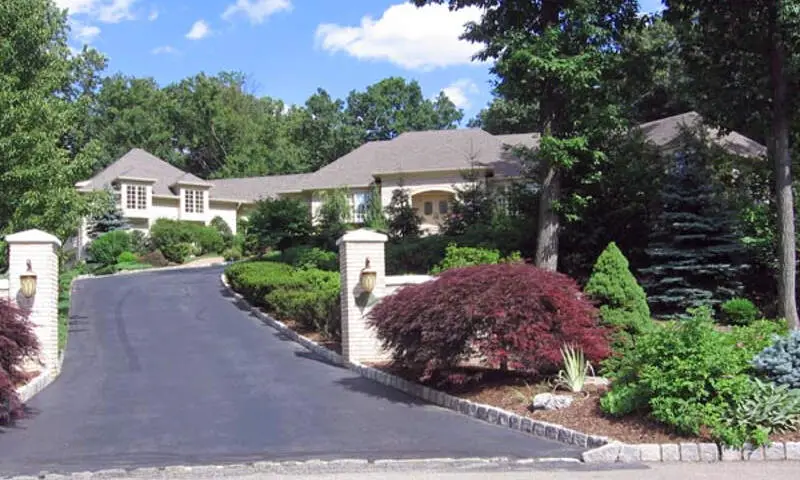
$250,001 median income · $2,183,827 median home · #2 home prices in New Jersey
Rumson is a borough in Monmouth County, New Jersey, United States and is part of the New York Metropolitan Area. As of the 2010 census, the borough’s population was 7,122, reflecting a decline of 15 from 7,137 in 2000, which had in turn increased by 436 from 6,701 in 1990.
Data | Crime | Cost of living | Movers
$230,611 median income · $1,733,277 median home · #3 home prices in New Jersey
Data | Crime | Cost of living | Movers
$235,795 median income · $1,557,852 median home · #4 home prices in New Jersey
Data | Crime | Cost of living | Movers
$250,001 median income · $1,412,975 median home · #6 home prices in New Jersey
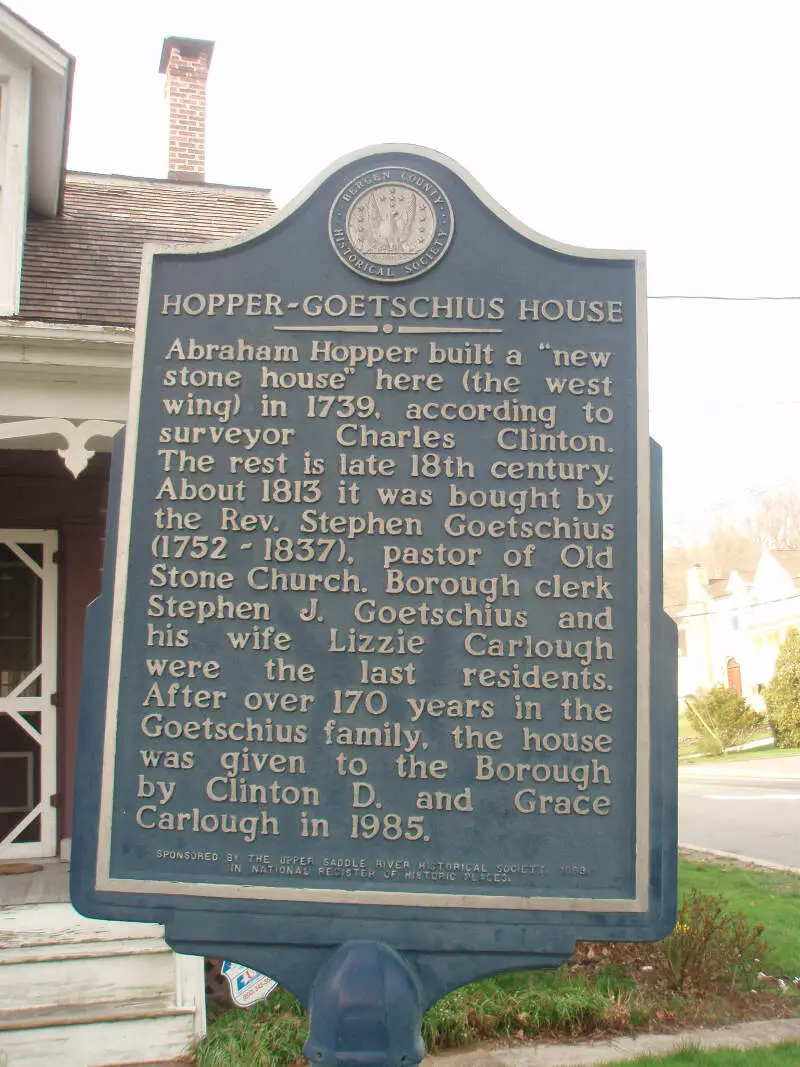
Upper Saddle River is a borough in Bergen County, New Jersey, United States. As of the 2010 United States Census, the borough’s population was 8,208, reflecting an increase of 467 from the 7,741 counted in the 2000 Census, which had in turn increased by 543 from the 7,198 counted in the 1990 Census. It is not to be confused with the neighboring borough of Saddle River.
Data | Crime | Cost of living | Movers
$208,200 median income · $1,262,422 median home · #10 home prices in New Jersey
Data | Crime | Cost of living | Movers
$250,001 median income · $1,483,127 median home · #5 home prices in New Jersey
Fair Haven is a borough in Monmouth County, New Jersey, along the Navesink River and is part of the New York Metropolitan Area. Fair Haven is located on the Rumson peninsula and is bordered by Red Bank and Little Silver to the west. As of the 2010 United States Census, the borough’s population was 6,121, reflecting an increase of 184 from the 5,937 counted in the 2000 Census, which had in turn increased by 667 from the 5,270 counted in the 1990 Census.
Data | Crime | Cost of living | Movers
$208,245 median income · $1,133,696 median home · #17 home prices in New Jersey
North Caldwell is a borough in northwestern Essex County, New Jersey, United States, and a suburb of New York City. As of the 2010 United States Census, the borough’s population was 6,183, reflecting a decline of 1,192 from the 7,375 counted in the 2000 Census, which had in turn increased by 669 from the 6,706 counted in the 1990 Census.
Data | Crime | Cost of living | Movers
$213,981 median income · $1,228,602 median home · #12 home prices in New Jersey
Woodcliff Lake is a borough in Bergen County, New Jersey, United States. As of the 2010 Census, the borough’s population was 5,730, reflecting a decline of 15 from the 5,745 counted in the 2000 Census, which had in turn increased by 442 from the 5,303 counted in the 1990 Census. Most of the borough mandates a minimum lot size of 22,500 square feet for single-family homes, with portions on the borough’s east zoned for 15,000 square feet and portions of the borough’s northwest and southwest zoned for 30,000 square feet lots.
Data | Crime | Cost of living | Movers
$240,853 median income · $1,110,500 median home · #19 home prices in New Jersey
Little Silver is a borough in Monmouth County, New Jersey, United States. As of the 2010 United States Census, the borough’s population was 5,950, a drop of 220 from the 6,170 counted in the 2000 Census, which had in turn increased by 449 from the 5,721 counted in the 1990 Census.
Data | Crime | Cost of living | Movers
The receipts
Compare the top ten
Pick a metric. The bars rescale. The red line is New Jersey’s statewide median.
New Jersey statewide median: $569,411
New Jersey statewide median: $103,556
On the map
Mapping the most expensive places in New Jersey
Saturday Night Science
Methodology: How We Determined The Most Expensive Places To Live In The Garden State For 2026
The two most important things to think about when it comes to being able to afford a city in New Jersey are how much money you make and how much you have to spend to live there.
You need to understand your costs in the context of how much money you make.
For example, if the median household earns $100,000 and spends $40,000 on housing, it’s actually cheaper to live there than a place with a median income of $50,000 and housing costs of $21,000. You might spend more on housing, but you have more money overall to play with.
With that example in mind, we derived several statistics from the latest Census American Community Survey 2020-2024 around incomes and costs. They are:
- Overall Cost Of Living Index
- Median Home Price / Median Income (lower is better)
- Median Income / Median Rent (Higher is better)
- Median Home Price
You can then compare these metrics in each of the places in New Jersey to figure out which is the most expensive.
You are left with a “Cost of Living Index” by taking the average rank of each of these metrics for each city.
So we used that cost of living index to rank all of the 262 places in New Jersey that have more than 5,000 people.
The place with the highest cost of living in New Jersey according to the data is Short Hills. We updated this article for 2026. This article is our eleventh time ranking the most expensive places to live in New Jersey.
The full plate
Most Expensive Cities In New Jersey
Click any column to sort. Search by city name.
| Rank | City | Cost Of Living | Population | Median Income | Average Home Price | Home/Income Ratio |
|---|---|---|---|---|---|---|
| 1 | Short Hills | 263 | 14,923 | $250,001 | $2,309,383 | 9.2x |
| 2 | Rumson | 238 | 7,241 | $250,001 | $2,183,827 | 8.7x |
| 3 | Englewood Cliffs | 235 | 5,362 | $230,611 | $1,733,277 | 7.5x |
| 4 | Franklin Lakes | 221 | 11,084 | $235,795 | $1,557,852 | 6.6x |
| 5 | Upper Saddle River | 213 | 8,439 | $250,001 | $1,412,975 | 5.7x |
| 6 | Tenafly | 204 | 15,319 | $208,200 | $1,262,422 | 6.1x |
| 7 | Fair Haven | 201 | 6,170 | $250,001 | $1,483,127 | 5.9x |
| 8 | North Caldwell | 200 | 6,656 | $208,245 | $1,133,696 | 5.4x |
| 9 | Woodcliff Lake | 196 | 6,152 | $213,981 | $1,228,602 | 5.7x |
| 10 | Little Silver | 195 | 6,105 | $240,853 | $1,110,500 | 4.6x |
| 11 | Hoboken | 191 | 58,668 | $180,579 | $855,399 | 4.7x |
| 12 | Summit | 190 | 22,705 | $190,304 | $1,372,011 | 7.2x |
| 13 | Chatham | 190 | 9,407 | $241,500 | $1,310,369 | 5.4x |
| 14 | Old Tappan | 189 | 6,008 | $205,385 | $1,224,145 | 6.0x |
| 15 | Upper Montclair | 184 | 12,457 | $250,001 | $1,239,321 | 5.0x |
| 16 | Mountainside | 183 | 7,049 | $211,538 | $1,043,568 | 4.9x |
| 17 | Westfield | 182 | 31,111 | $232,629 | $1,269,853 | 5.5x |
| 18 | Ridgewood | 182 | 26,308 | $208,211 | $1,200,489 | 5.8x |
| 19 | Watchung | 182 | 6,485 | $173,672 | $1,060,985 | 6.1x |
| 20 | Cresskill | 181 | 9,174 | $170,376 | $1,000,899 | 5.9x |
| 21 | Blackwells Mills | 179 | 10,301 | $250,001 | $921,032 | 3.7x |
| 22 | Madison | 178 | 16,447 | $171,471 | $990,723 | 5.8x |
| 23 | Closter | 176 | 8,606 | $190,469 | $1,153,806 | 6.1x |
| 24 | Paramus | 175 | 26,568 | $144,349 | $1,039,757 | 7.2x |
| 25 | Edgewater | 174 | 14,759 | $124,050 | $714,157 | 5.8x |
| 26 | Florham Park | 174 | 13,564 | $158,696 | $1,025,256 | 6.5x |
| 27 | Glen Rock | 174 | 12,154 | $215,096 | $1,056,914 | 4.9x |
| 28 | Allendale | 174 | 6,865 | $160,162 | $1,073,640 | 6.7x |
| 29 | Bernardsville | 173 | 7,916 | $236,115 | $1,003,867 | 4.3x |
| 30 | Manasquan | 173 | 5,922 | $142,944 | $1,158,873 | 8.1x |
| 31 | Norwood | 172 | 5,724 | $178,311 | $898,894 | 5.0x |
| 32 | Glen Ridge | 171 | 7,943 | $250,001 | $1,125,697 | 4.5x |
| 33 | Kinnelon | 170 | 10,013 | $187,438 | $836,759 | 4.5x |
| 34 | Oradell | 170 | 8,235 | $221,322 | $975,412 | 4.4x |
| 35 | Oceanport | 168 | 6,195 | $126,094 | $910,435 | 7.2x |
| 36 | New Providence | 167 | 13,727 | $161,599 | $990,084 | 6.1x |
| 37 | Martinsville | 166 | 11,559 | $205,000 | $902,737 | 4.4x |
| 38 | Montvale | 164 | 8,901 | $178,269 | $920,951 | 5.2x |
| 39 | Morris Plains | 164 | 6,315 | $154,923 | $727,186 | 4.7x |
| 40 | Ramsey | 163 | 14,805 | $160,996 | $863,404 | 5.4x |
| 41 | Park Ridge | 163 | 9,406 | $171,029 | $845,038 | 4.9x |
| 42 | Belle Mead | 163 | 6,394 | $223,250 | $1,015,391 | 4.5x |
| 43 | Roseland | 163 | 6,268 | $164,458 | $819,880 | 5.0x |
| 44 | Belmar | 162 | 5,869 | $93,573 | $1,009,846 | 10.8x |
| 45 | Palisades Park | 160 | 20,290 | $94,743 | $987,743 | 10.4x |
| 46 | Robertsville | 157 | 12,035 | $210,661 | $858,503 | 4.1x |
| 47 | Emerson | 156 | 7,305 | $155,536 | $780,190 | 5.0x |
| 48 | Ocean City | 155 | 11,261 | $101,782 | $1,099,877 | 10.8x |
| 49 | Hillsdale | 155 | 10,144 | $186,688 | $843,788 | 4.5x |
| 50 | Morganville | 155 | 5,902 | $161,500 | $851,870 | 5.3x |
| 51 | East Freehold | 155 | 5,096 | $189,219 | $809,381 | 4.3x |
| 52 | Secaucus | 154 | 21,778 | $139,821 | $662,670 | 4.7x |
| 53 | Princeton Meadows | 154 | 15,561 | $131,213 | $834,192 | 6.4x |
| 54 | Fanwood | 154 | 7,799 | $195,529 | $791,728 | 4.0x |
| 55 | Bradley Gardens | 152 | 14,165 | $177,849 | $684,571 | 3.8x |
| 56 | River Edge | 152 | 12,091 | $159,028 | $839,655 | 5.3x |
| 57 | North Haledon | 152 | 8,778 | $125,313 | $712,134 | 5.7x |
| 58 | Lakewood | 151 | 69,585 | $56,968 | $576,896 | 10.1x |
| 59 | Fairview | 151 | 15,099 | $63,606 | $654,535 | 10.3x |
| 60 | Leonia | 151 | 9,336 | $129,665 | $808,460 | 6.2x |
| 61 | Midland Park | 151 | 7,019 | $146,841 | $732,465 | 5.0x |
| 62 | Lincroft | 151 | 6,939 | $189,000 | $1,007,765 | 5.3x |
| 63 | Franklin Center | 151 | 6,646 | $157,212 | $766,901 | 4.9x |
| 64 | Haddonfield | 150 | 12,595 | $200,400 | $830,377 | 4.1x |
| 65 | Margate City | 150 | 5,234 | $121,800 | $1,097,066 | 9.0x |
| 66 | Morristown | 149 | 20,453 | $121,340 | $887,262 | 7.3x |
| 67 | Metuchen | 149 | 15,144 | $158,052 | $683,090 | 4.3x |
| 68 | Oakland | 149 | 12,768 | $162,019 | $750,020 | 4.6x |
| 69 | Ridgefield | 149 | 11,498 | $118,059 | $778,380 | 6.6x |
| 70 | Rutherford | 147 | 18,894 | $143,153 | $738,683 | 5.2x |
| 71 | Westwood | 147 | 11,283 | $165,781 | $755,182 | 4.6x |
| 72 | Jersey City | 146 | 294,078 | $97,710 | $658,269 | 6.7x |
| 73 | Monmouth Junction | 146 | 9,141 | $133,585 | $690,687 | 5.2x |
| 74 | Heathcote | 146 | 7,717 | $141,295 | $711,137 | 5.0x |
| 75 | Fair Lawn | 145 | 35,610 | $144,574 | $709,175 | 4.9x |
| 76 | Cliffside Park | 145 | 25,781 | $93,452 | $645,671 | 6.9x |
| 77 | Waldwick | 145 | 10,164 | $177,962 | $738,299 | 4.1x |
| 78 | Caldwell | 145 | 9,003 | $96,824 | $724,635 | 7.5x |
| 79 | Green Knoll | 145 | 6,789 | $165,227 | $748,229 | 4.5x |
| 80 | West Long Branch | 144 | 8,586 | $114,271 | $959,620 | 8.4x |
| 81 | Wood-Ridge | 142 | 10,218 | $136,108 | $709,508 | 5.2x |
| 82 | Yorketown | 142 | 7,261 | $173,510 | $749,357 | 4.3x |
| 83 | Ramtown | 142 | 6,203 | $145,663 | $610,889 | 4.2x |
| 84 | Beach Haven West | 142 | 5,120 | $119,394 | $804,118 | 6.7x |
| 85 | Succasunna | 141 | 9,799 | $161,712 | $650,100 | 4.0x |
| 86 | Dayton | 141 | 7,952 | $151,902 | $654,995 | 4.3x |
| 87 | Carlstadt | 141 | 6,378 | $115,444 | $656,613 | 5.7x |
| 88 | Hawthorne | 140 | 19,628 | $110,237 | $629,474 | 5.7x |
| 89 | New Milford | 140 | 16,995 | $114,889 | $727,507 | 6.3x |
| 90 | West Freehold | 140 | 14,883 | $130,800 | $662,893 | 5.1x |
| 91 | Hasbrouck Heights | 140 | 12,115 | $123,734 | $709,659 | 5.7x |
| 92 | Kendall Park | 140 | 10,011 | $165,958 | $728,058 | 4.4x |
| 93 | Lake Mohawk | 140 | 9,508 | $149,135 | $553,497 | 3.7x |
| 94 | Tinton Falls | 139 | 19,361 | $117,308 | $624,719 | 5.3x |
| 95 | Point Pleasant | 139 | 19,334 | $115,625 | $733,630 | 6.3x |
| 96 | Red Bank | 139 | 12,862 | $97,477 | $693,365 | 7.1x |
| 97 | Brookdale | 139 | 9,960 | $161,779 | $718,656 | 4.4x |
| 98 | White Meadow Lake | 139 | 8,842 | $149,324 | $589,962 | 4.0x |
| 99 | Elmwood Park | 138 | 21,412 | $101,740 | $616,473 | 6.1x |
| 100 | Asbury Park | 138 | 15,295 | $75,544 | $686,057 | 9.1x |
Source: U.S. Census ACS 2020-2024, Zillow research. 262 places with more than 5,000 residents.
Summary
Summary: Taking A Chunk Out Of Your Paycheck In New Jersey For 2026
Well, there you have it, the places in New Jersey that have the highest cost of living, with Short Hills ranking as the most expensive city in the Garden State.
The most expensive cities in New Jersey are Short Hills, Rumson, Englewood Cliffs, Franklin Lakes, Upper Saddle River, Tenafly, Fair Haven, North Caldwell, Woodcliff Lake, and Little Silver.


