Paramus SnackAbility
Overall SnackAbility
Crime in Paramus summary. We use data from the FBI to determine the crime rates in Paramus. Key points include:
There were 1,318 total crimes in Paramus in the last reporting year.
The overall crime rate per 100,000 people in Paramus is 4,928.0 / 100k people.
The violent crime rate per 100,000 people in Paramus is 29.9 / 100k people.
The property crime rate per 100,000 people in Paramus is 4,898.1 / 100k people.
Overall, crime in Paramus is 132.54% above the national average.
Total Crimes
Above National Average
Crime In Paramus Comparison Table
| Statistic | Count Raw |
Paramus / 100k People |
New Jersey / 100k People |
National / 100k People |
|---|---|---|---|---|
| Total Crimes Per 100K | 1,318 | 4,928.0 | 1,645.1 | 2,119.2 |
| Violent Crime | 8 | 29.9 | 217.7 | 359.0 |
| Murder | 2 | 7.5 | 2.3 | 5.0 |
| Robbery | 3 | 11.2 | 49.3 | 61.0 |
| Aggravated Assault | 3 | 11.2 | 148.8 | 256.0 |
| Property Crime | 1,310 | 4,898.1 | 1,427.3 | 1,760.0 |
| Burglary | 55 | 205.6 | 145.3 | 229.0 |
| Larceny | 1,218 | 4,554.1 | 1,119.4 | 1,272.0 |
| Car Theft | 37 | 138.3 | 162.6 | 259.0 |
Source: FBI Uniform Crime Reporting (2024)
Cost of living in Paramus summary. We use data on the cost of living to determine how expensive it is to live in Paramus. Real estate prices drive most of the variance in cost of living around New Jersey. Key points include:
The cost of living in Paramus is 175 with 100 being average.
The cost of living in Paramus is 1.8x higher than the national average.
The median home value in Paramus is $1,039,756.
The median income in Paramus is $144,349.
Paramus's Overall Cost Of Living
Higher Than The National Average
Cost Of Living In Paramus Comparison Table
| Living Expense | Paramus | New Jersey | National Average |
|---|---|---|---|
| Overall | 175 | 125 | 100 |
| Services | 108 | 107 | 100 |
| Groceries | 109 | 113 | 100 |
| Health | 320 | 155 | 100 |
| Housing | 109 | 116 | 100 |
| Transportation | 109 | 112 | 100 |
| Utilities | 112 | 113 | 100 |
Source: Cost of living index, normalized to US average = 100
Paramus, NJ Weather
The average high in Paramus is 62.9° and the average low is 44.2°.
There are 73.9 days of precipitation each year.
Expect an average of 47.9 inches of precipitation each year with 25.4 inches of snow.
| Stat | Paramus |
|---|---|
| Average Annual High | 62.9 |
| Average Annual Low | 44.2 |
| Annual Precipitation Days | 73.9 |
| Average Annual Precipitation | 47.9 |
| Average Annual Snowfall | 25.4 |
Average High
Days of Rain
Source: NOAA climate normals (30-year)
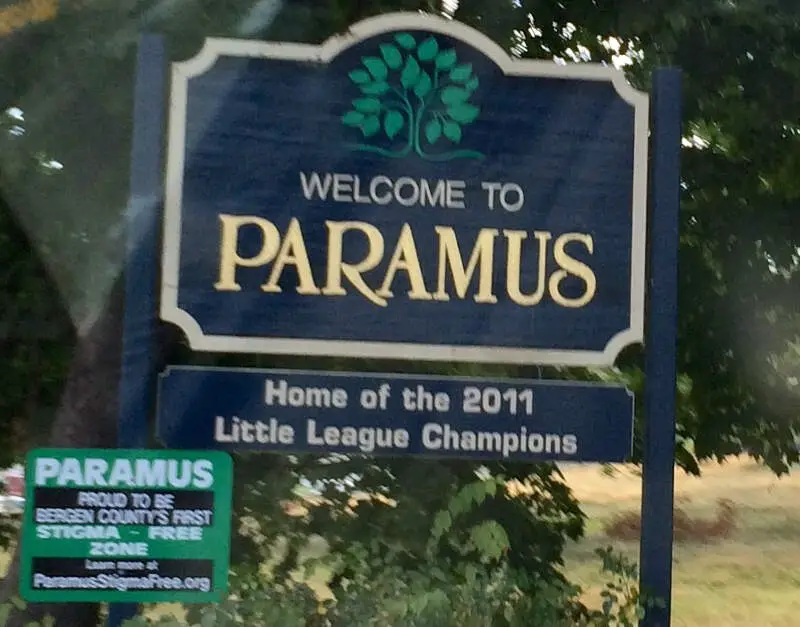
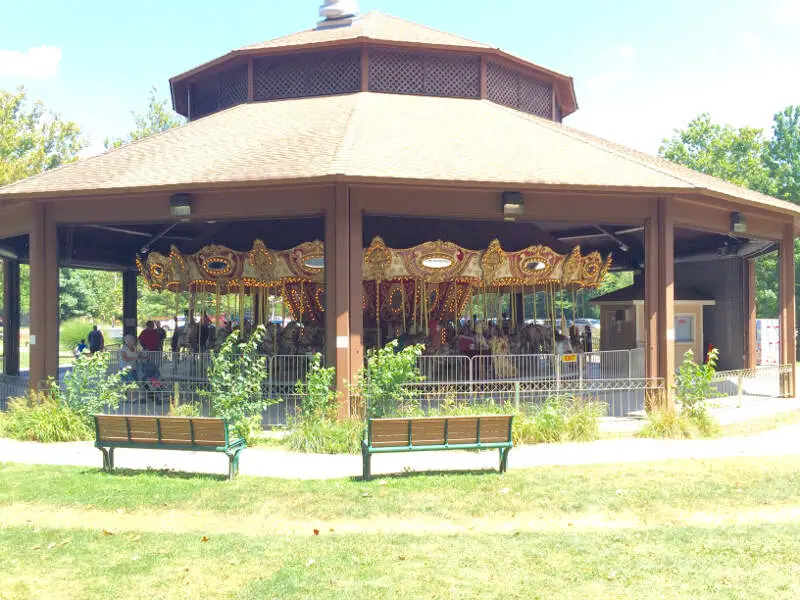
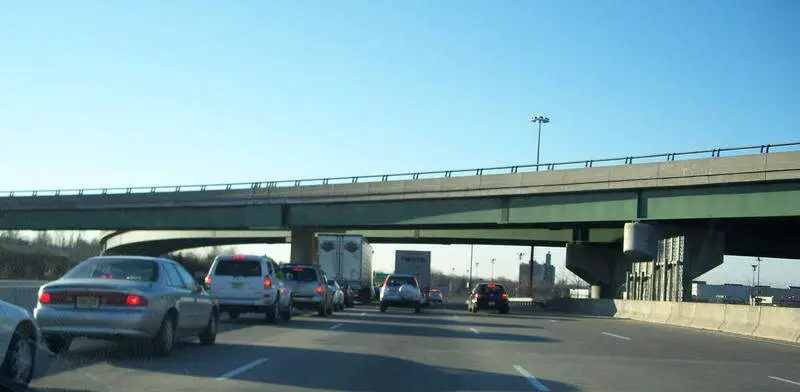
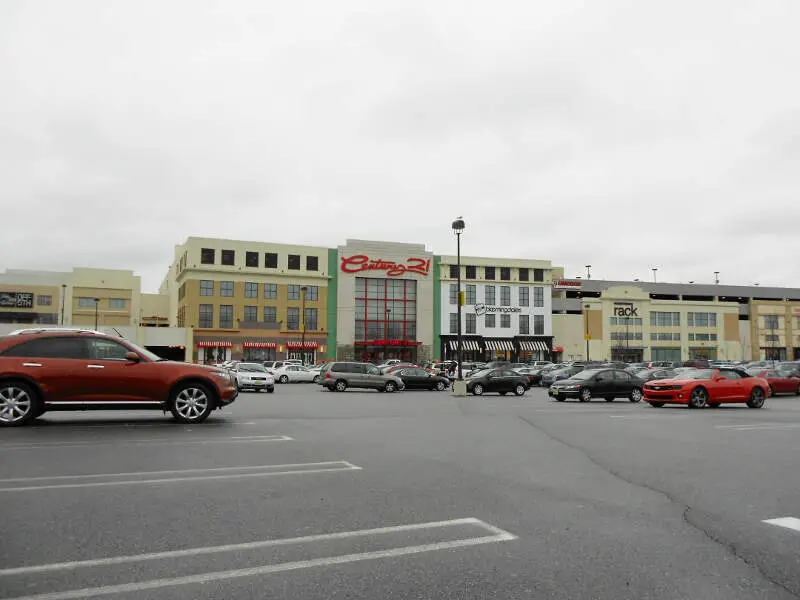
Paramus, NJ Photos


1 Reviews & Comments About Paramus

It's a safe town, with lots of retail and diversity.
There's loads of malls and stores and restaurants, but also nice parks and things to do. It's a great place to grow up
Rankings & Articles For Paramus


Locations Around Paramus
Map Of Paramus, NJ
Best Places Around Paramus
Bronxville, NY
Population 6,510
Pelham Manor, NY
Population 5,644
Pleasantville, NY
Population 7,371
Larchmont, NY
Population 6,567
Briarcliff Manor, NY
Population 7,519
Tappan, NY
Population 6,687
Irvington, NY
Population 6,531
Mamaroneck, NY
Population 19,826
Blauvelt, NY
Population 5,406
Eastchester, NY
Population 20,491
Paramus Demographics And Statistics
Population over time in Paramus
The current population in Paramus is 26,568. The population has increased 1.9% from 2010.
| Year | Population | % Change |
|---|---|---|
| 2024 | 26,568 | 0.3% |
| 2023 | 26,500 | -0.3% |
| 2022 | 26,582 | -0.3% |
| 2021 | 26,650 | 0.9% |
| 2020 | 26,403 | -0.4% |
| 2019 | 26,503 | -0.4% |
| 2018 | 26,613 | -1.1% |
| 2017 | 26,919 | 0.5% |
| 2016 | 26,795 | 0.1% |
| 2015 | 26,760 | 0.6% |
| 2014 | 26,612 | 0.6% |
| 2013 | 26,454 | 0.6% |
| 2012 | 26,301 | 0.4% |
| 2011 | 26,197 | 0.4% |
| 2010 | 26,084 | - |
Race / Ethnicity in Paramus
See the full breakdown
Paramus is:
54.1% White with 14,362 White residents.
4.1% African American with 1,079 African American residents.
0.6% American Indian with 156 American Indian residents.
25.7% Asian with 6,821 Asian residents.
0.0% Hawaiian with 0 Hawaiian residents.
0.3% Other with 80 Other residents.
2.3% Two Or More with 606 Two Or More residents.
13.0% Hispanic with 3,464 Hispanic residents.
| Race | Paramus | NJ | USA |
|---|---|---|---|
| White | 54.1% | 50.9% | 57.4% |
| African American | 4.1% | 12.2% | 11.9% |
| American Indian | 0.6% | 0.1% | 0.5% |
| Asian | 25.7% | 10.0% | 5.9% |
| Hawaiian | 0.0% | 0.0% | 0.2% |
| Other | 0.3% | 0.8% | 0.6% |
| Two Or More | 2.3% | 3.5% | 4.3% |
| Hispanic | 13.0% | 22.5% | 19.3% |
Gender in Paramus
See the full breakdown
Paramus is 49.8% female with 13,232 female residents.
Paramus is 50.2% male with 13,335 male residents.
| Gender | Paramus | NJ | USA |
|---|---|---|---|
| Female | 49.8% | 50.8% | 50.5% |
| Male | 50.2% | 49.2% | 49.5% |
Highest level of educational attainment in Paramus for adults over 25
See the full breakdown
5.0% of adults in Paramus completed < 9th grade.
2.0% of adults in Paramus completed 9-12th grade.
21.0% of adults in Paramus completed high school / ged.
14.0% of adults in Paramus completed some college.
6.0% of adults in Paramus completed associate's degree.
32.0% of adults in Paramus completed bachelor's degree.
15.0% of adults in Paramus completed master's degree.
3.0% of adults in Paramus completed professional degree.
2.0% of adults in Paramus completed doctorate degree.
| Education | Paramus | NJ | USA |
|---|---|---|---|
| < 9th Grade | 5.0% | 4.0% | 4.0% |
| 9-12th Grade | 2.0% | 5.0% | 6.0% |
| High School / GED | 21.0% | 25.0% | 26.0% |
| Some College | 14.0% | 15.0% | 19.0% |
| Associate's Degree | 6.0% | 7.0% | 9.0% |
| Bachelor's Degree | 32.0% | 26.0% | 22.0% |
| Master's Degree | 15.0% | 13.0% | 10.0% |
| Professional Degree | 3.0% | 3.0% | 2.0% |
| Doctorate Degree | 2.0% | 2.0% | 2.0% |
Household Income For Paramus, New Jersey
See the full breakdown
1.6% of households in Paramus earn Less than $10,000.
1.0% of households in Paramus earn $10,000 to $14,999.
3.6% of households in Paramus earn $15,000 to $24,999.
4.6% of households in Paramus earn $25,000 to $34,999.
5.3% of households in Paramus earn $35,000 to $49,999.
9.7% of households in Paramus earn $50,000 to $74,999.
9.1% of households in Paramus earn $75,000 to $99,999.
16.4% of households in Paramus earn $100,000 to $149,999.
16.9% of households in Paramus earn $150,000 to $199,999.
31.7% of households in Paramus earn $200,000 or more.
| Income | Paramus | NJ | USA |
|---|---|---|---|
| Less than $10,000 | 1.6% | 4.1% | 5.0% |
| $10,000 to $14,999 | 1.0% | 2.7% | 3.4% |
| $15,000 to $24,999 | 3.6% | 4.8% | 6.3% |
| $25,000 to $34,999 | 4.6% | 5.1% | 6.6% |
| $35,000 to $49,999 | 5.3% | 7.6% | 10.1% |
| $50,000 to $74,999 | 9.7% | 12.8% | 15.5% |
| $75,000 to $99,999 | 9.1% | 11.3% | 12.6% |
| $100,000 to $149,999 | 16.4% | 18.1% | 17.5% |
| $150,000 to $199,999 | 16.9% | 11.8% | 9.6% |
| $200,000 or more | 31.7% | 21.6% | 13.4% |
Source: U.S. Census ACS 5-year estimates (2024)


