Before you decide to relocate to New Mexico, it’s important to research the exact cost of living around the state. And that’s what we’re going to help you do.
These are the places in New Mexico that cost a pretty penny — the most expensive cities in the state.
We used Saturday Night Science to compare the 2020-2024 American Community Survey on cost of living for the 34 places in New Mexico with more than 5,000 people.
After we saved up for months and could finally afford it, we landed on this list of the ten most expensive cities in New Mexico for 2026.
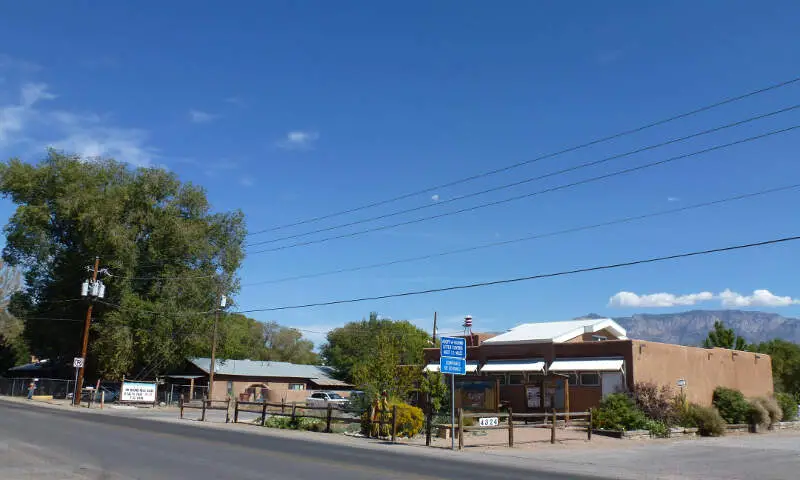
$102,307 median income · $703,889 median home · #2 home prices in New Mexico
Corrales is a village in Sandoval County, New Mexico, United States. The population was 8,329 at the 2010 Census. With proximity to the Rio Grande, the village was founded for agricultural purposes. The Rio Grande Bosque on the eastern edge of the village provides refuge for native animals and plants. The village fights hard to maintain its rural character in light of being surrounded by the rapidly expanding cities of Rio Rancho and Albuquerque.
Data | Crime | Cost of living | Movers
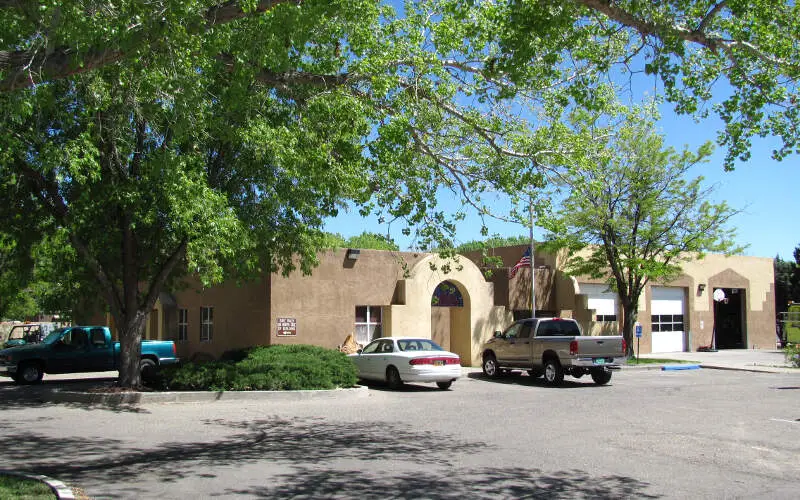
$72,992 median income · $705,207 median home · #1 home prices in New Mexico
Data | Crime | Cost of living | Movers
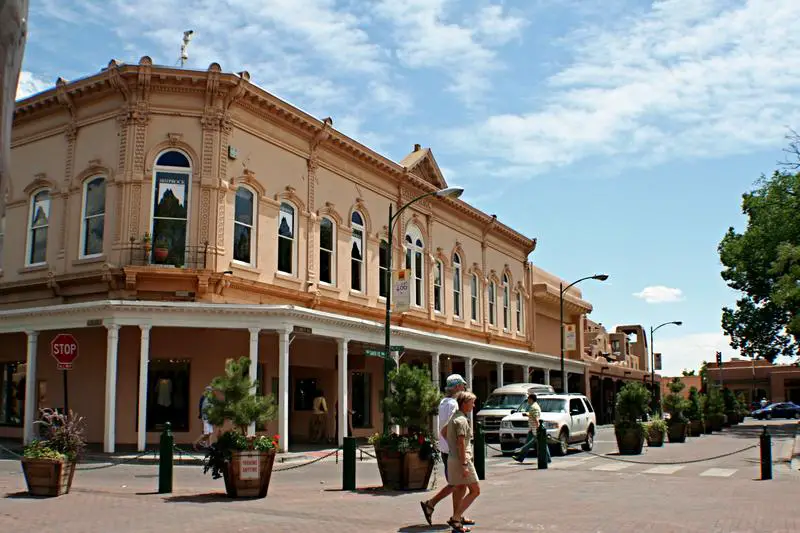
$73,482 median income · $580,022 median home · #3 home prices in New Mexico
Santa Fe is the capital of the state of New Mexico. It is the fourth-largest city in the state and the seat of Santa Fe County.
Data | Crime | Cost of living | Movers
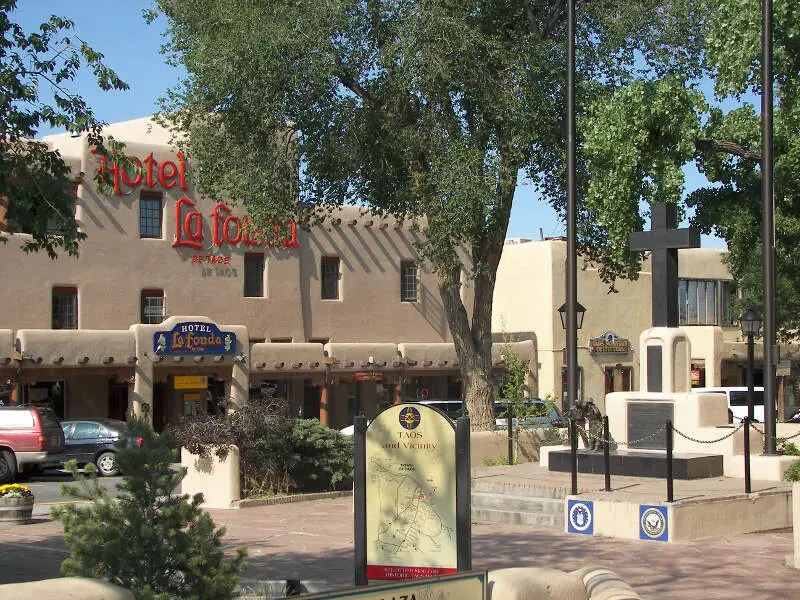
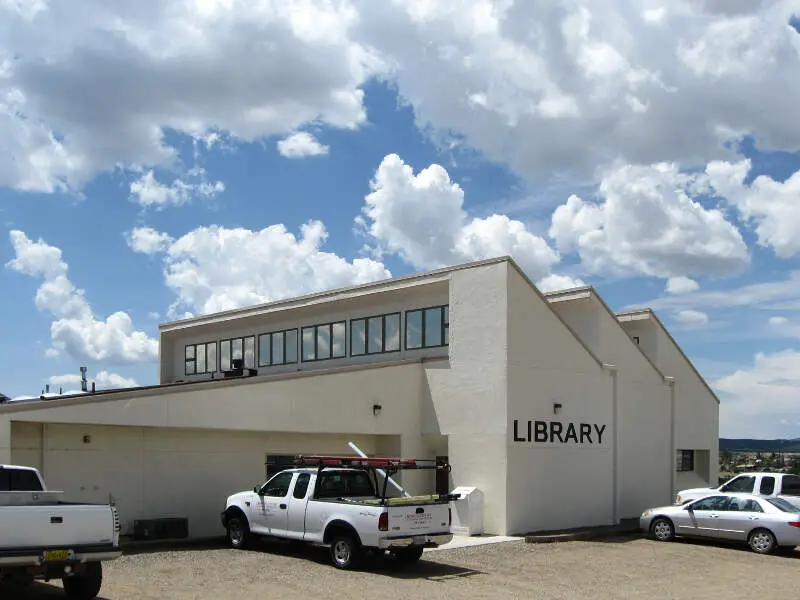
$47,304 median income · $439,303 median home · #4 home prices in New Mexico
Taos is a town in Taos County in the north-central region of New Mexico in the Sangre de Cristo Mountains, incorporated in 1934. As of the 2010 census, its population was 5,716. Other nearby communities include Ranchos de Taos, Caon, Taos Canyon, Ranchitos, El Prado, and Arroyo Seco. The town is close to Taos Pueblo, the Native American village and tribe from which it takes its name.
Data | Crime | Cost of living | Movers
$84,761 median income · $382,908 median home · #5 home prices in New Mexico
Data | Crime | Cost of living | Movers
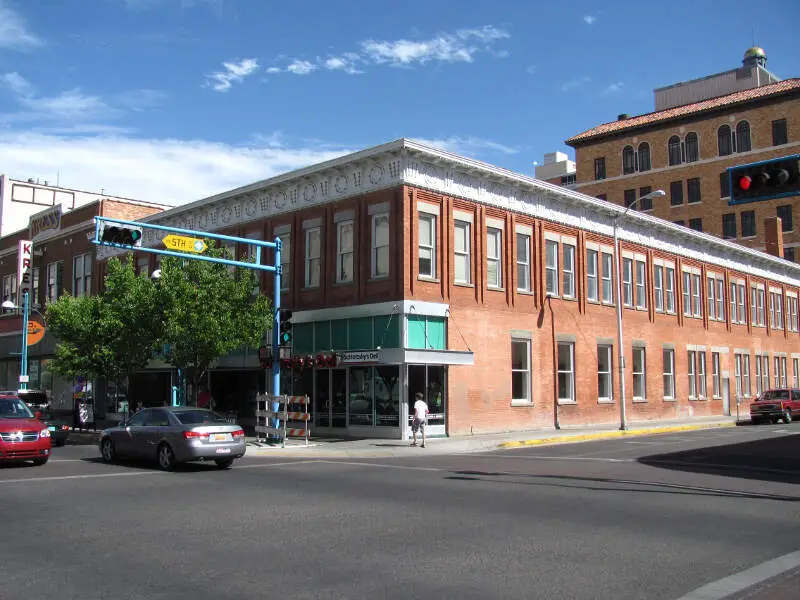
$68,317 median income · $344,457 median home · #8 home prices in New Mexico
Albuquerque AL-b-kur-kee; Navajo: Beeeldl Dahsinil ) is the most populous city in the U.S. state of New Mexico. The high-elevation city serves as the county seat of Bernalillo County, and it is situated in the north central part of the state, straddling the Rio Grande. The city population is 559,277 as of the July 1, 2016 population estimate from the United States Census Bureau, and ranks as the 32nd-largest city in the U.S. The Albuquerque metropolitan statistical area has a population of 909,906 according to the United States Census Bureau’s most recently available estimate for 2016. Albuquerque is the 60th-largest United States metropolitan area. The Albuquerque MSA population includes the city of Rio Rancho, Bernalillo, Placitas, Corrales, Los Lunas, Belen, Bosque Farms, and forms part of the larger Albuquerque-Santa Fe-Las Vegas combined statistical area, with a total population of 1,171,991 as of the July 1, 2016, Census Bureau estimates.
Data | Crime | Cost of living | Movers
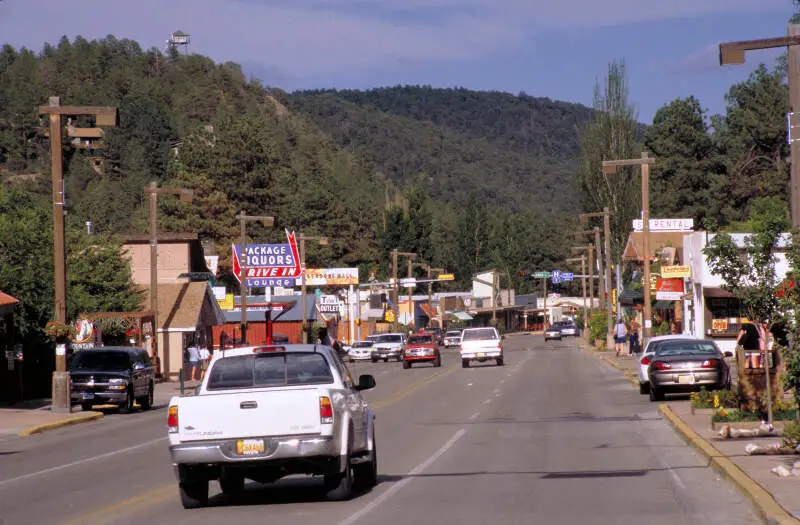
$52,736 median income · $332,550 median home · #9 home prices in New Mexico
Ruidoso is a village in Lincoln County, New Mexico, United States, adjacent to the Lincoln National Forest. The population was 8,029 at the 2010 census. The city of Ruidoso Downs and the unincorporated area of Alto are suburbs of Ruidoso, and contribute to the Ruidoso Micropolitan Statistical Area’s population of 21,223.
Data | Crime | Cost of living | Movers

$89,596 median income · $361,856 median home · #6 home prices in New Mexico
Rio Rancho is the largest city and economic hub of Sandoval County in the U.S. state of New Mexico. A small portion of the city extends into northern Bernalillo County. It is the third-largest and also one of the fastest expanding cities in New Mexico. As of the 2010 census, Rio Rancho had a population of 93,820.
Data | Crime | Cost of living | Movers
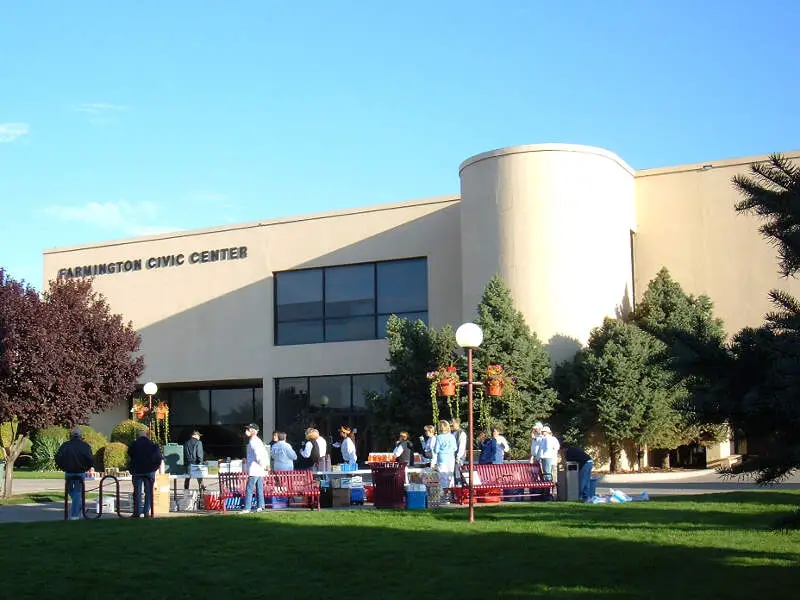
$68,784 median income · $276,499 median home · #12 home prices in New Mexico
Farmington is a city in San Juan County in the US state of New Mexico. As of the 2013 population estimate from the United States Census Bureau the city had a total population of 45,426 people. Farmington makes up one of the four Metropolitan Statistical Areas in New Mexico. The U.S. Census Bureau’s population estimate in 2011 for Farmington was about 45,256.
Data | Crime | Cost of living | Movers
$62,330 median income · $324,074 median home · #10 home prices in New Mexico
Los Lunas is a village in Valencia County, New Mexico, in the United States. As of the 2010 census, the village population is 14,835 inside the village limits due to the new housing developments at El Cerro de Los Lunas. It is the county seat of Valencia County.
Data | Crime | Cost of living | Movers
The receipts
Compare the top ten
Pick a metric. The bars rescale. The red line is New Mexico’s statewide median.
New Mexico statewide median: $316,750
New Mexico statewide median: $64,059
On the map
Mapping the most expensive places in New Mexico
Saturday Night Science
Methodology: How We Determined The Most Expensive Places To Live In The Land of Enchantment For 2026
The two most important things to think about when it comes to being able to afford a city in New Mexico are how much money you make and how much you have to spend to live there.
You need to understand your costs in the context of how much money you make.
For example, if the median household earns $100,000 and spends $40,000 on housing, it’s actually cheaper to live there than a place with a median income of $50,000 and housing costs of $21,000. You might spend more on housing, but you have more money overall to play with.
With that example in mind, we derived several statistics from the latest Census American Community Survey 2020-2024 around incomes and costs. They are:
- Overall Cost Of Living Index
- Median Home Price / Median Income (lower is better)
- Median Income / Median Rent (Higher is better)
- Median Home Price
You can then compare these metrics in each of the places in New Mexico to figure out which is the most expensive.
You are left with a “Cost of Living Index” by taking the average rank of each of these metrics for each city.
So we used that cost of living index to rank all of the 34 places in New Mexico that have more than 5,000 people.
The place with the highest cost of living in New Mexico according to the data is Corrales. We updated this article for 2026. This article is our eleventh time ranking the most expensive places to live in New Mexico.
The full plate
Most Expensive Cities In New Mexico
Click any column to sort. Search by city name.
| Rank | City | Cost Of Living | Population | Median Income | Average Home Price | Home/Income Ratio |
|---|---|---|---|---|---|---|
| 1 | Corrales | 131 | 8,555 | $102,307 | $703,889 | 6.9x |
| 2 | Los Ranchos de Albuquerque | 127 | 5,857 | $72,992 | $705,207 | 9.7x |
| 3 | Santa Fe | 113 | 89,019 | $73,482 | $580,022 | 7.9x |
| 4 | Taos | 107 | 6,458 | $47,304 | $439,303 | 9.3x |
| 5 | Edgewood | 103 | 6,124 | $84,761 | $382,908 | 4.5x |
| 6 | Albuquerque | 102 | 562,218 | $68,317 | $344,457 | 5.0x |
| 7 | Ruidoso | 101 | 7,699 | $52,736 | $332,550 | 6.3x |
| 8 | Rio Rancho | 100 | 108,515 | $89,596 | $361,856 | 4.0x |
| 9 | Farmington | 99 | 46,314 | $68,784 | $276,499 | 4.0x |
| 10 | Los Lunas | 99 | 18,618 | $62,330 | $324,074 | 5.2x |
| 11 | Carlsbad | 98 | 31,746 | $72,306 | $251,561 | 3.5x |
| 12 | Artesia | 98 | 12,576 | $74,915 | $245,540 | 3.3x |
| 13 | Bernalillo | 96 | 9,086 | $63,880 | $347,987 | 5.4x |
| 14 | Aztec | 95 | 6,150 | $41,977 | $274,928 | 6.5x |
| 15 | Las Cruces | 93 | 114,197 | $55,422 | $290,023 | 5.2x |
| 16 | Sunland Park | 93 | 17,463 | $62,814 | $223,741 | 3.6x |
| 17 | Raton | 93 | 6,026 | $52,641 | $152,896 | 2.9x |
| 18 | Clovis | 92 | 37,942 | $54,820 | $161,214 | 2.9x |
| 19 | Silver City | 92 | 9,536 | $38,711 | $225,704 | 5.8x |
| 20 | Hobbs | 91 | 40,252 | $64,021 | $207,135 | 3.2x |
| 21 | Alamogordo | 91 | 31,307 | $55,952 | $223,173 | 4.0x |
| 22 | Socorro | 91 | 8,481 | $39,375 | $190,942 | 4.8x |
| 23 | Bloomfield | 91 | 7,395 | $48,472 | $252,908 | 5.2x |
| 24 | Roswell | 90 | 47,638 | $51,583 | $173,067 | 3.4x |
| 25 | Gallup | 90 | 21,023 | $58,303 | $219,327 | 3.8x |
| 26 | Lovington | 90 | 11,498 | $68,821 | $174,979 | 2.5x |
| 27 | Las Vegas | 88 | 13,000 | $45,125 | $241,426 | 5.4x |
| 28 | Portales | 88 | 11,968 | $50,555 | $134,844 | 2.7x |
| 29 | Anthony | 87 | 8,767 | $38,132 | $235,806 | 6.2x |
| 30 | Belen | 87 | 7,450 | $42,627 | $266,792 | 6.3x |
| 31 | Grants | 85 | 8,951 | $47,183 | $154,827 | 3.3x |
| 32 | Deming | 84 | 15,221 | $34,165 | $163,668 | 4.8x |
| 33 | Truth or Consequences | 83 | 6,019 | $33,788 | $152,062 | 4.5x |
| 34 | Tucumcari | 81 | 5,160 | $31,844 | $83,369 | 2.6x |
Source: U.S. Census ACS 2020-2024, Zillow research. 34 places with more than 5,000 residents.
Summary
Summary: Taking A Chunk Out Of Your Paycheck In New Mexico For 2026
Well, there you have it, the places in New Mexico that have the highest cost of living, with Corrales ranking as the most expensive city in the Land of Enchantment.
The most expensive cities in New Mexico are Corrales, Los Ranchos de Albuquerque, Santa Fe, Taos, Edgewood, Albuquerque, Ruidoso, Rio Rancho, Farmington, and Los Lunas.


