Compare Las Cruces to…
Las Cruces SnackAbility
Overall SnackAbility
Crime in Las Cruces summary. We use data from the FBI to determine the crime rates in Las Cruces. Key points include:
There were 6,487 total crimes in Las Cruces in the last reporting year.
The overall crime rate per 100,000 people in Las Cruces is 5,593.4 / 100k people.
The violent crime rate per 100,000 people in Las Cruces is 720.0 / 100k people.
The property crime rate per 100,000 people in Las Cruces is 4,873.4 / 100k people.
Overall, crime in Las Cruces is 163.93% above the national average.
Total Crimes
Above National Average
Crime In Las Cruces Comparison Table
| Statistic | Count Raw |
Las Cruces / 100k People |
New Mexico / 100k People |
National / 100k People |
|---|---|---|---|---|
| Total Crimes Per 100K | 6,487 | 5,593.4 | 3,468.2 | 2,119.2 |
| Violent Crime | 835 | 720.0 | 717.1 | 359.0 |
| Murder | 14 | 12.1 | 10.5 | 5.0 |
| Robbery | 67 | 57.8 | 65.3 | 61.0 |
| Aggravated Assault | 687 | 592.4 | 587.5 | 256.0 |
| Property Crime | 5,652 | 4,873.4 | 2,751.1 | 1,760.0 |
| Burglary | 855 | 737.2 | 500.3 | 229.0 |
| Larceny | 3,993 | 3,442.9 | 1,750.9 | 1,272.0 |
| Car Theft | 804 | 693.2 | 499.9 | 259.0 |
Source: FBI Uniform Crime Reporting (2024)
Cost of living in Las Cruces summary. We use data on the cost of living to determine how expensive it is to live in Las Cruces. Real estate prices drive most of the variance in cost of living around New Mexico. Key points include:
The cost of living in Las Cruces is 93 with 100 being average.
The cost of living in Las Cruces is 0.9x lower than the national average.
The median home value in Las Cruces is $290,022.
The median income in Las Cruces is $55,422.
Las Cruces's Overall Cost Of Living
Lower Than The National Average
Cost Of Living In Las Cruces Comparison Table
| Living Expense | Las Cruces | New Mexico | National Average |
|---|---|---|---|
| Overall | 93 | 93 | 100 |
| Services | 94 | 98 | 100 |
| Groceries | 101 | 96 | 100 |
| Health | 85 | 86 | 100 |
| Housing | 99 | 99 | 100 |
| Transportation | 97 | 95 | 100 |
| Utilities | 95 | 94 | 100 |
Source: Cost of living index, normalized to US average = 100
Las Cruces, NM Weather
The average high in Las Cruces is 76.9° and the average low is 47.0°.
There are 24.6 days of precipitation each year.
Expect an average of 10.6 inches of precipitation each year with 2.6 inches of snow.
| Stat | Las Cruces |
|---|---|
| Average Annual High | 76.9 |
| Average Annual Low | 47.0 |
| Annual Precipitation Days | 24.6 |
| Average Annual Precipitation | 10.6 |
| Average Annual Snowfall | 2.6 |
Average High
Days of Rain
Source: NOAA climate normals (30-year)
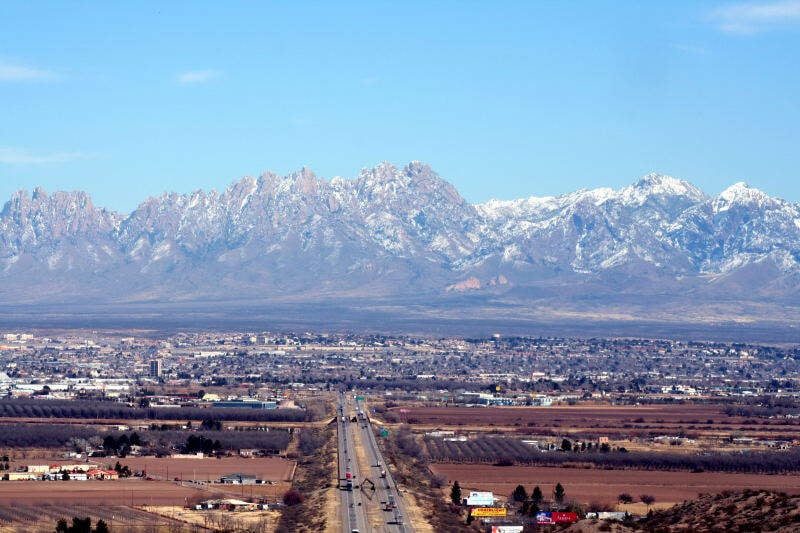
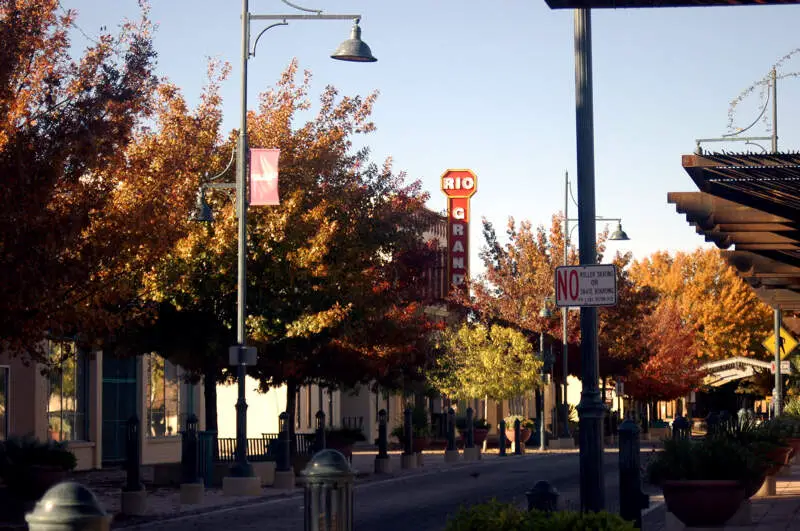
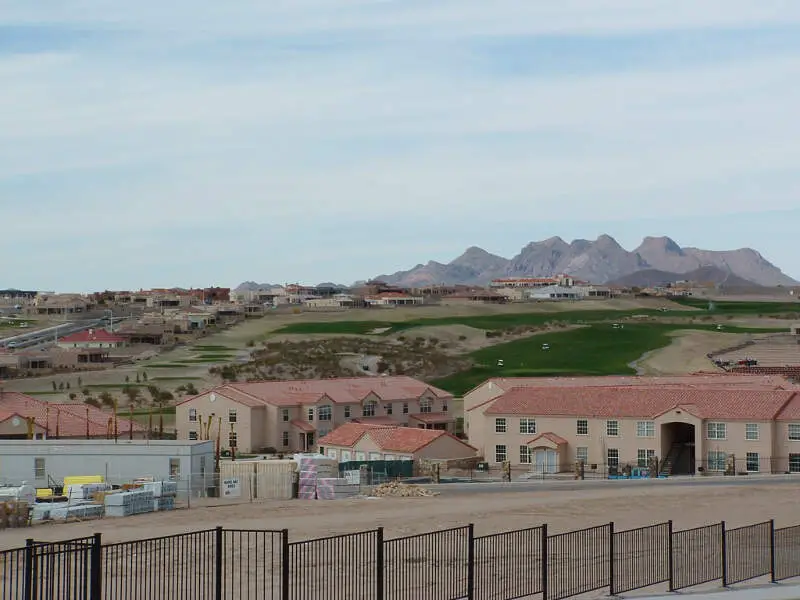
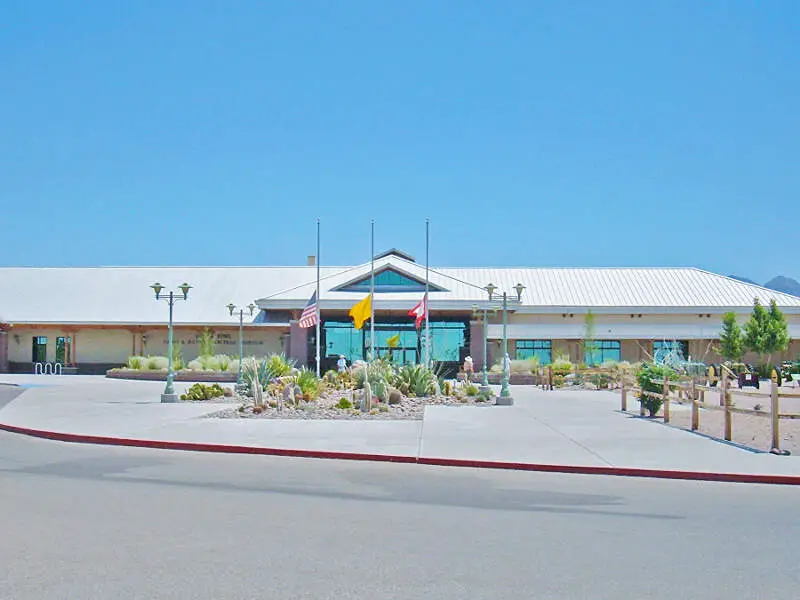
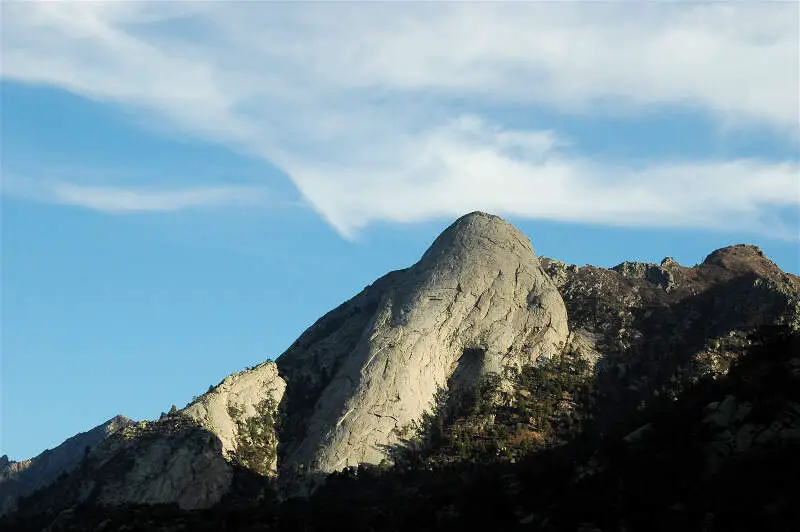
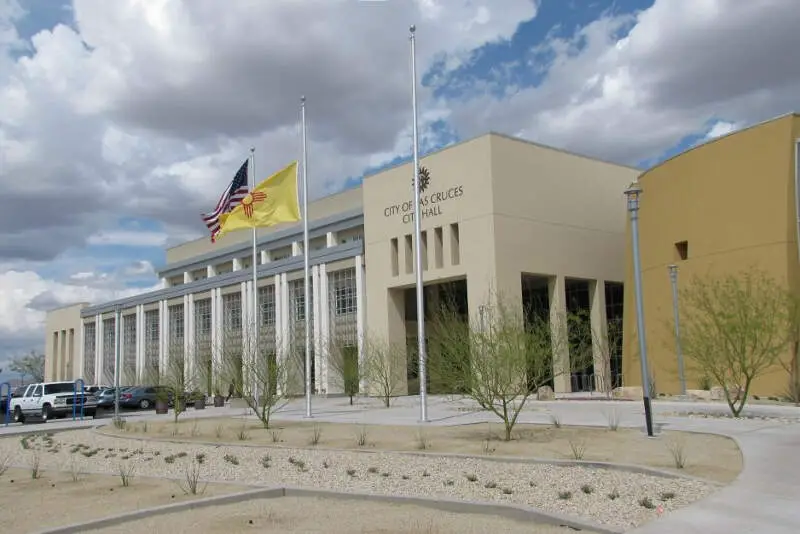
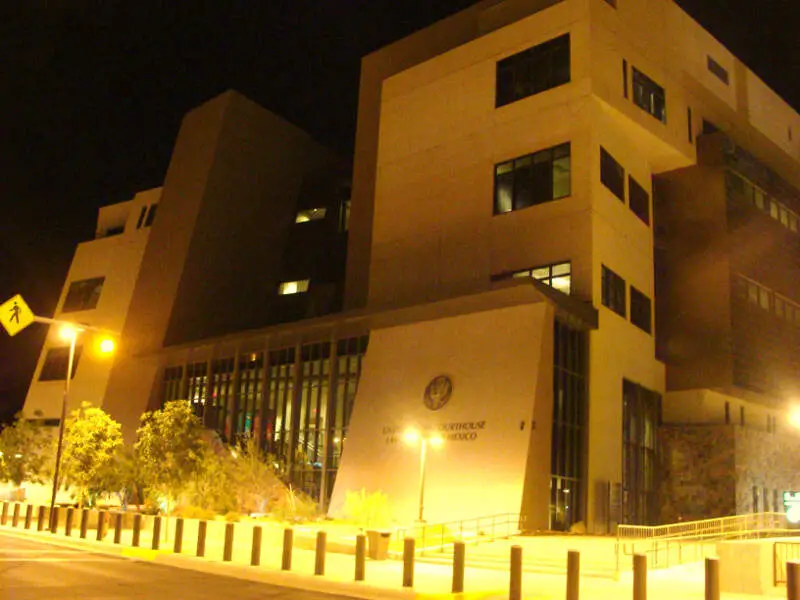
Las Cruces, NM Photos


3 Reviews & Comments About Las Cruces

I lived in Las Cruces, NM for 9 years. I moved there for college and then stayed for a time as I worked my first post college jobs. I lived in apartments and houses, depending on what I was renting. I lived there from 1992 to 2001.
I loved the food: they have their own local twist on Mexican food, the Mesilla Valley tradition, that is absolutely delicious. Hatch green chile and the local, southern NM spice mix are the underlying reasons. The local people are really friendly. The cost of living was very low.
Beautiful weather, great scenery, low cost of living. Crime rate has increased, though, over the last two years.
Old Mesilla is a place where Billy the Kid was and is full of boutiques and great restaurants. There is bad construction in major streets that will often last over one year.
I have lived in NM for many years, and I find NM very beautiful and the people are very pleasant and helpful. I have traveled extensively through NM from Las Cruces to Pie Town to Socorro to Roswell, to Hobbs to Taos, to Albuquerque to Pinehill, to Ramah to Tucumcari to Raton to Gallup to Zuni. People have always been nice and helpful. I realize that there are issues in NM as there are everywhere, in every state.
Rankings & Articles For Las Cruces


Locations Around Las Cruces
Map Of Las Cruces, NM
Best Places Around Las Cruces
El Paso, TX
Population 680,130
Sunland Park, NM
Population 17,463
Santa Teresa, NM
Population 6,041
Anthony, NM
Population 8,767
Chaparral, NM
Population 18,186
Las Cruces Demographics And Statistics
Population over time in Las Cruces
The current population in Las Cruces is 114,197. The population has increased 22.9% from 2010.
| Year | Population | % Change |
|---|---|---|
| 2024 | 114,197 | 1.4% |
| 2023 | 112,612 | 1.2% |
| 2022 | 111,273 | 1.2% |
| 2021 | 109,934 | 6.8% |
| 2020 | 102,950 | 0.8% |
| 2019 | 102,102 | 0.4% |
| 2018 | 101,742 | 0.7% |
| 2017 | 101,014 | -0.4% |
| 2016 | 101,459 | 0.3% |
| 2015 | 101,164 | 0.8% |
| 2014 | 100,360 | 1.2% |
| 2013 | 99,186 | 1.8% |
| 2012 | 97,393 | 2.3% |
| 2011 | 95,233 | 2.5% |
| 2010 | 92,897 | - |
Race / Ethnicity in Las Cruces
See the full breakdown
Las Cruces is:
32.6% White with 37,213 White residents.
1.9% African American with 2,186 African American residents.
0.8% American Indian with 887 American Indian residents.
1.7% Asian with 1,958 Asian residents.
0.0% Hawaiian with 28 Hawaiian residents.
0.2% Other with 281 Other residents.
2.4% Two Or More with 2,796 Two Or More residents.
60.3% Hispanic with 68,848 Hispanic residents.
| Race | Las Cruces | NM | USA |
|---|---|---|---|
| White | 32.6% | 36.0% | 57.4% |
| African American | 1.9% | 1.8% | 11.9% |
| American Indian | 0.8% | 8.5% | 0.5% |
| Asian | 1.7% | 1.6% | 5.9% |
| Hawaiian | 0.0% | 0.1% | 0.2% |
| Other | 0.2% | 0.5% | 0.6% |
| Two Or More | 2.4% | 3.1% | 4.3% |
| Hispanic | 60.3% | 48.4% | 19.3% |
Gender in Las Cruces
See the full breakdown
Las Cruces is 50.7% female with 57,936 female residents.
Las Cruces is 49.3% male with 56,260 male residents.
| Gender | Las Cruces | NM | USA |
|---|---|---|---|
| Female | 50.7% | 50.3% | 50.5% |
| Male | 49.3% | 49.7% | 49.5% |
Highest level of educational attainment in Las Cruces for adults over 25
See the full breakdown
6.0% of adults in Las Cruces completed < 9th grade.
6.0% of adults in Las Cruces completed 9-12th grade.
21.0% of adults in Las Cruces completed high school / ged.
21.0% of adults in Las Cruces completed some college.
10.0% of adults in Las Cruces completed associate's degree.
20.0% of adults in Las Cruces completed bachelor's degree.
12.0% of adults in Las Cruces completed master's degree.
2.0% of adults in Las Cruces completed professional degree.
2.0% of adults in Las Cruces completed doctorate degree.
| Education | Las Cruces | NM | USA |
|---|---|---|---|
| < 9th Grade | 6.0% | 5.0% | 4.0% |
| 9-12th Grade | 6.0% | 7.0% | 6.0% |
| High School / GED | 21.0% | 26.0% | 26.0% |
| Some College | 21.0% | 22.0% | 19.0% |
| Associate's Degree | 10.0% | 9.0% | 9.0% |
| Bachelor's Degree | 20.0% | 17.0% | 22.0% |
| Master's Degree | 12.0% | 10.0% | 10.0% |
| Professional Degree | 2.0% | 2.0% | 2.0% |
| Doctorate Degree | 2.0% | 2.0% | 2.0% |
Household Income For Las Cruces, New Mexico
See the full breakdown
8.4% of households in Las Cruces earn Less than $10,000.
6.6% of households in Las Cruces earn $10,000 to $14,999.
11.9% of households in Las Cruces earn $15,000 to $24,999.
8.8% of households in Las Cruces earn $25,000 to $34,999.
10.2% of households in Las Cruces earn $35,000 to $49,999.
18.8% of households in Las Cruces earn $50,000 to $74,999.
11.8% of households in Las Cruces earn $75,000 to $99,999.
12.0% of households in Las Cruces earn $100,000 to $149,999.
6.7% of households in Las Cruces earn $150,000 to $199,999.
4.8% of households in Las Cruces earn $200,000 or more.
| Income | Las Cruces | NM | USA |
|---|---|---|---|
| Less than $10,000 | 8.4% | 6.6% | 5.0% |
| $10,000 to $14,999 | 6.6% | 5.1% | 3.4% |
| $15,000 to $24,999 | 11.9% | 8.5% | 6.3% |
| $25,000 to $34,999 | 8.8% | 8.4% | 6.6% |
| $35,000 to $49,999 | 10.2% | 11.2% | 10.1% |
| $50,000 to $74,999 | 18.8% | 16.9% | 15.5% |
| $75,000 to $99,999 | 11.8% | 12.4% | 12.6% |
| $100,000 to $149,999 | 12.0% | 15.5% | 17.5% |
| $150,000 to $199,999 | 6.7% | 7.6% | 9.6% |
| $200,000 or more | 4.8% | 7.8% | 13.4% |
Source: U.S. Census ACS 5-year estimates (2024)


