Most Native American places in Nevada research summary. We used Saturday Night Science to research the Nevada cities with the highest percentage of Native American residents for 2026. The data comes from the American Community Survey 2020-2024 vintage, which breaks down race by origin.
The city with the highest percentage of Native Americans is Yerington. 4.57% of people in Yerington are Native Americans.
The city with the lowest percentage of Native Americans is Nellis AFB. 0.00% of people in Nellis AFB are Native American.
The city with the most Native Americans is Las Vegas. 1,715 people in Las Vegas are Native American.
The city with the fewest Native Americans is Nellis AFB. 0 people in Nellis AFB are Native American.
The United States has 1,698,432 Native Americans and is 0.51% Native American.
Which city in Nevada had the largest Native American population? The place with the largest Native American population in Nevada for 2026 is Yerington. 4.57% of Yerington identify as Native American.
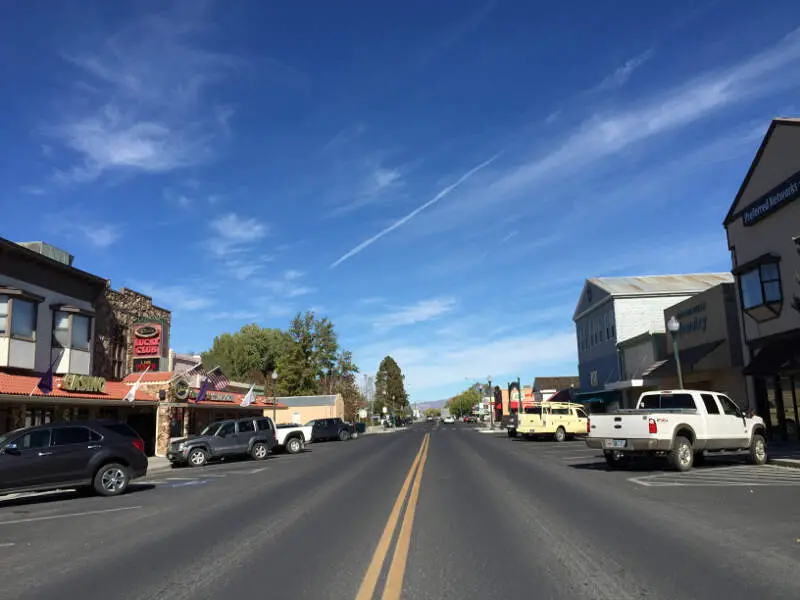
4.6% Native American · 144 Native American residents
Yerington is a city in Lyon County, Nevada, United States. The population was 3,048 at the 2010 census. It is named after Henry M. Yerington, Superintendent of the Virginia and Truckee Railroad from 1868 to 1910. The city incorporated in 1907. It is the current county seat of Lyon County, the first county seat being established at Dayton on November 29, 1861. After the Dayton Court House burned down in 1909, the seat was moved to Yerington in 1911.
Data | Crime | Cost of living | Movers
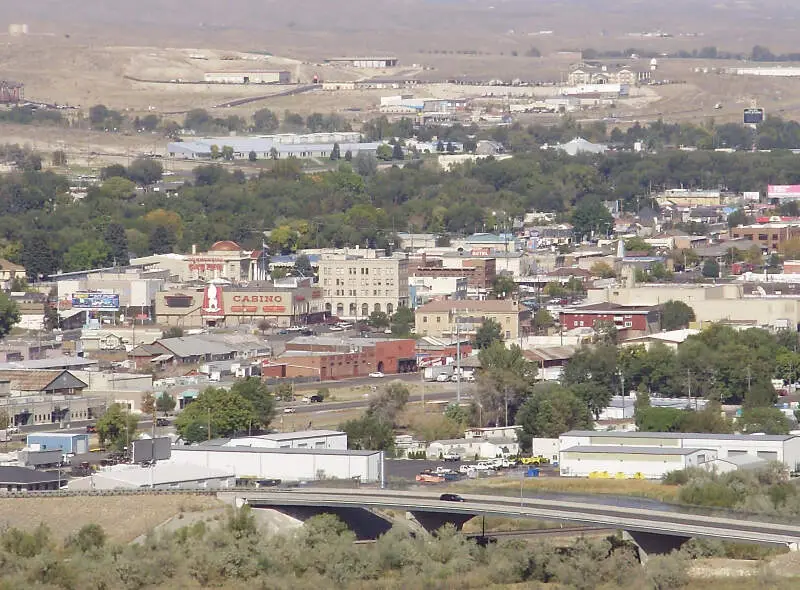
3.1% Native American · 648 Native American residents
Coordinates: 4050N 11546W 40.833; -115.767 Elko is the largest city and county seat of Elko County, Nevada, United States. The population was 18,297 at the 2010 census. The city straddles the Humboldt River.
Data | Crime | Cost of living | Movers
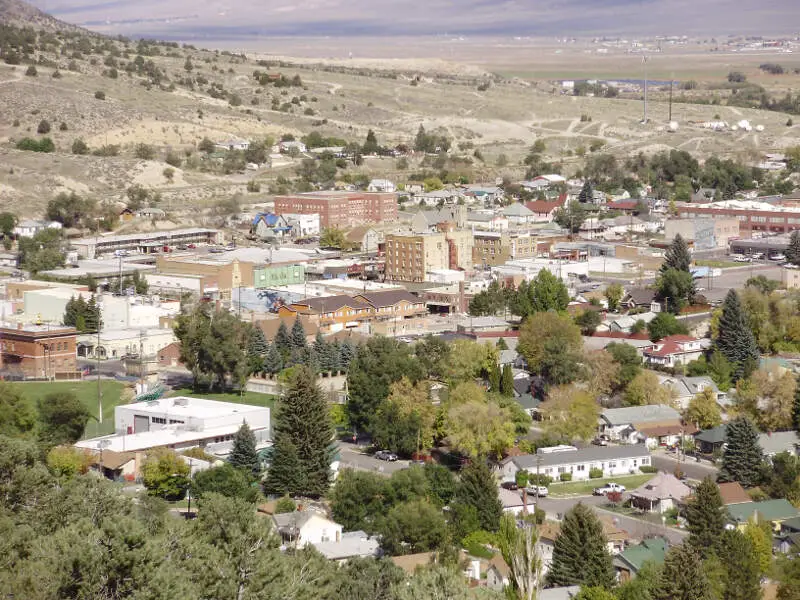
2.3% Native American · 91 Native American residents
Data | Crime | Cost of living | Movers
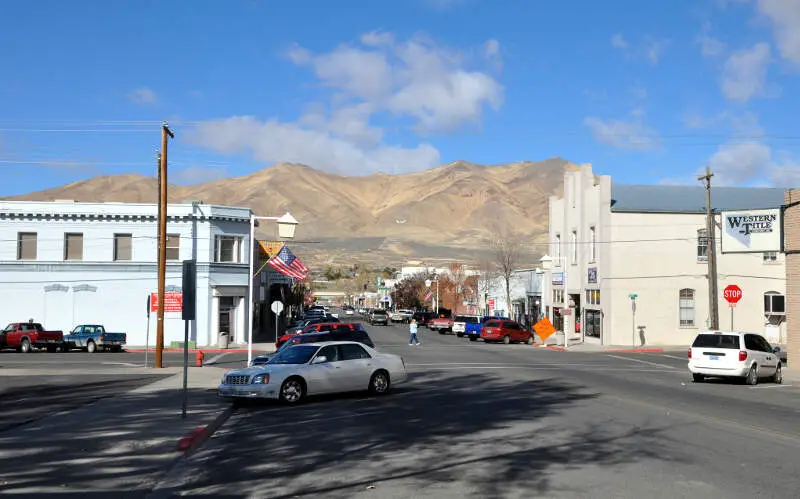
2.2% Native American · 46 Native American residents
Carlin is a small city located near the western border of Elko County in northeast Nevada, 23 miles west of the city of Elko. It is part of the Elko Micropolitan Statistical Area. Carlin sits along Interstate 80 at an elevation of approximately 4,900 feet. As of the 2010 census, its population was 2,368, up from 2,161 at the 2000 census. The city was named for Civil War general William Passmore Carlin. Its slogan is “Where the Train Stops…And the Gold Rush Begins”.
1.6% Native American · 57 Native American residents
Data | Crime | Cost of living | Movers
1.6% Native American · 88 Native American residents
Data | Crime | Cost of living | Movers
1.4% Native American · 113 Native American residents
Winnemucca ) is the only incorporated city in and is the county seat of Humboldt County, Nevada, United States. As of the 2010 census, the city had a total population of 7,396, up 3.1 percent from the 2000 census figure of 7,174. Interstate 80 passes through the city, where it meets U.S. Route 95.
Data | Crime | Cost of living | Movers
1.2% Native American · 52 Native American residents
Data | Crime | Cost of living | Movers
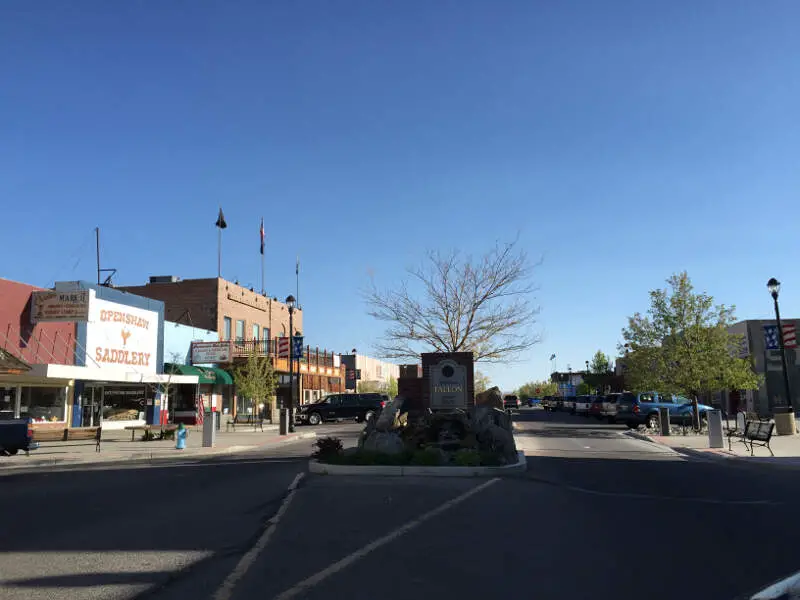
1.1% Native American · 104 Native American residents
Fallon is a city in Churchill County, Nevada, United States. The population was 8,606 at time of the 2010 census. Fallon is the county seat of Churchill County and is located in the Lahontan Valley.
Fallon and Churchill County are mostly agricultural areas. Although the area is arid, approximately 50,000 acres of its pastureland are irrigated with water from the Truckee-Carson Irrigation District. The principal crop grown is alfalfa for livestock feed. The “Heart O’ Gold” cantaloupes of Churchill County were once distributed across the United States, but are now grown mostly for consumption in Nevada.
Data | Crime | Cost of living | Movers
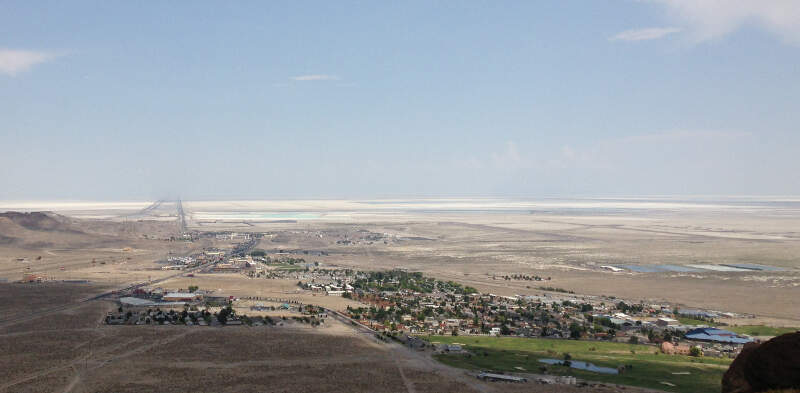
1.0% Native American · 44 Native American residents
West Wendover is a small city in Elko County, Nevada, United States. The population was 4,410 at the 2010 census. It is part of the Elko micropolitan area. West Wendover is located on the eastern border of Nevada and the western edge of the Great Salt Lake Desert and is contiguous with Wendover, Utah, with which it is sometimes confused. Interstate 80 runs just north of the cities, while Interstate 80 Business runs through the two cities.
Data | Crime | Cost of living | Movers
The receipts
Compare the top ten
Pick a metric. The bars rescale. The red line is Nevada’s statewide median.
On the map
Where Nevada’s Native American population is concentrated
Saturday Night Science
Methodology: How We Determined The Cities In Nevada With The Largest Native American Population For 2026
We still believe in the accuracy of data — especially from the Census. So that’s where we went to get the race breakdown across Nevada.
We used Saturday Night Science to analyze the Census’s most recently available data, the 2020-2024 American Community Survey data.
Specifically, we looked at table B03002: Hispanic OR LATINO ORIGIN BY RACE. Here are the category names as defined by the Census:
- Hispanic or Latino
- White alone
- Black or African American alone
- American Indian and Alaska Native alone
- Asian alone
- Native Hawaiian and Other Pacific Islander alone
- Some other race alone
- Two or more races
Our particular column of interest here was the number of people identifying as American Indian and Alaska Native alone.
We limited our analysis to places with a population greater than 2,000 people. That left us with 43 cities.
We then calculated the percentage of residents that are American Indian and Alaska Native. The percentages ranked from 4.57 to 0.00.
Finally, we ranked each city based on the percentage of the American Indian and Alaska Native population, with a higher score being more American Indian and Alaska Native than a lower score. Yerington took the distinction of being the most American Indian and Alaska Native, while Nellis AFB was the least Native American city.
We updated this article for 2026. This article is our eleventh time ranking the cities in Nevada with the largest Native American population.
The full plate
Most Native American Places In Nevada
Click any column to sort. Search by city name.
| Rank | City | Population | Native American Population | % Native American |
|---|---|---|---|---|
| 1 | Yerington | 3,150 | 144 | 4.6% |
| 2 | Elko | 20,696 | 648 | 3.1% |
| 3 | Ely | 3,929 | 91 | 2.3% |
| 4 | Carlin | 2,088 | 46 | 2.2% |
| 5 | Battle Mountain | 3,518 | 57 | 1.6% |
| 6 | Gardnerville | 5,486 | 88 | 1.6% |
| 7 | Winnemucca | 8,361 | 113 | 1.4% |
| 8 | Lemmon Valley | 4,412 | 52 | 1.2% |
| 9 | Fallon | 9,463 | 104 | 1.1% |
| 10 | West Wendover | 4,514 | 44 | 1.0% |
| 11 | Dayton | 15,781 | 150 | 1.0% |
| 12 | Fernley | 24,225 | 229 | 0.9% |
| 13 | Pahrump | 47,347 | 353 | 0.7% |
| 14 | Indian Hills | 5,527 | 38 | 0.7% |
| 15 | Spanish Springs | 17,980 | 123 | 0.7% |
| 16 | Silver Springs | 5,060 | 31 | 0.6% |
| 17 | Hawthorne | 2,809 | 17 | 0.6% |
| 18 | Johnson Lane | 6,467 | 34 | 0.5% |
| 19 | Reno | 273,212 | 1,424 | 0.5% |
| 20 | Moapa Valley | 6,684 | 34 | 0.5% |
| 21 | Sun Valley | 22,228 | 113 | 0.5% |
| 22 | Mesquite | 22,059 | 94 | 0.4% |
| 23 | Enterprise | 240,464 | 922 | 0.4% |
| 24 | Henderson | 332,141 | 1,261 | 0.4% |
| 25 | North Las Vegas | 278,595 | 936 | 0.3% |
| 26 | Spring Valley | 219,187 | 732 | 0.3% |
| 27 | Boulder City | 14,919 | 49 | 0.3% |
| 28 | Sunrise Manor | 200,218 | 584 | 0.3% |
| 29 | Paradise | 185,913 | 516 | 0.3% |
| 30 | Laughlin | 8,789 | 24 | 0.3% |
| 31 | Sparks | 110,024 | 292 | 0.3% |
| 32 | Las Vegas | 660,400 | 1,715 | 0.3% |
| 33 | Spring Creek | 14,739 | 34 | 0.2% |
| 34 | Minden | 3,707 | 8 | 0.2% |
| 35 | Incline Village | 9,272 | 19 | 0.2% |
| 36 | Winchester | 37,081 | 75 | 0.2% |
| 37 | Cold Springs | 11,321 | 10 | 0.1% |
| 38 | Summerlin South | 31,354 | 12 | 0.0% |
| 39 | Whitney | 47,221 | 17 | 0.0% |
| 41 | Kingsbury | 2,209 | 0 | 0.0% |
| 41 | Washoe Valley | 3,315 | 0 | 0.0% |
| 41 | Gardnerville Ranchos | 12,114 | 0 | 0.0% |
| 41 | Nellis AFB | 5,087 | 0 | 0.0% |
Source: U.S. Census ACS 2020-2024, table B03002. 43 Nevada cities with more than 2,000 residents.
Summary
Summary: Native American Populations Across Nevada
If you’re looking for a breakdown of Native American populations across Nevada according to the most recent data, this is an accurate list.
The most Native American cities in Nevada are Yerington, Elko, Ely, Carlin, Battle Mountain, Gardnerville, Winnemucca, Lemmon Valley, Fallon, and West Wendover.


