Compare Las Vegas to…
Las Vegas SnackAbility
Overall SnackAbility
Cost of living in Las Vegas summary. We use data on the cost of living to determine how expensive it is to live in Las Vegas. Real estate prices drive most of the variance in cost of living around Nevada. Key points include:
The cost of living in Las Vegas is 116 with 100 being average.
The cost of living in Las Vegas is 1.2x higher than the national average.
The median home value in Las Vegas is $426,582.
The median income in Las Vegas is $73,877.
Las Vegas's Overall Cost Of Living
Higher Than The National Average
Cost Of Living In Las Vegas Comparison Table
| Living Expense | Las Vegas | Nevada | National Average |
|---|---|---|---|
| Overall | 116 | 105 | 100 |
| Services | 103 | 103 | 100 |
| Groceries | 106 | 102 | 100 |
| Health | 145 | 101 | 100 |
| Housing | 105 | 102 | 100 |
| Transportation | 113 | 109 | 100 |
| Utilities | 100 | 103 | 100 |
Source: Cost of living index, normalized to US average = 100
Las Vegas, NV Weather
The average high in Las Vegas is 79.3° and the average low is 53.5°.
There are 12.8 days of precipitation each year.
Expect an average of 4.8 inches of precipitation each year with 0.4 inches of snow.
| Stat | Las Vegas |
|---|---|
| Average Annual High | 79.3 |
| Average Annual Low | 53.5 |
| Annual Precipitation Days | 12.8 |
| Average Annual Precipitation | 4.8 |
| Average Annual Snowfall | 0.4 |
Average High
Days of Rain
Source: NOAA climate normals (30-year)
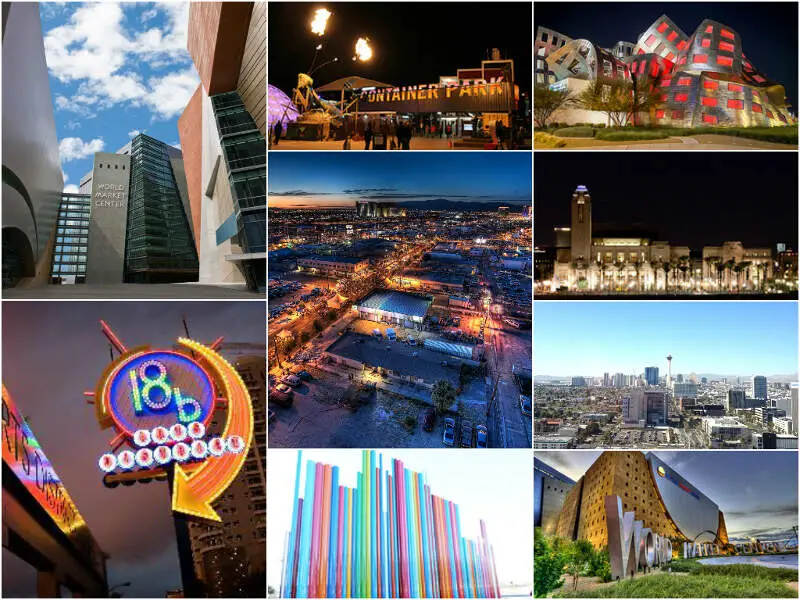
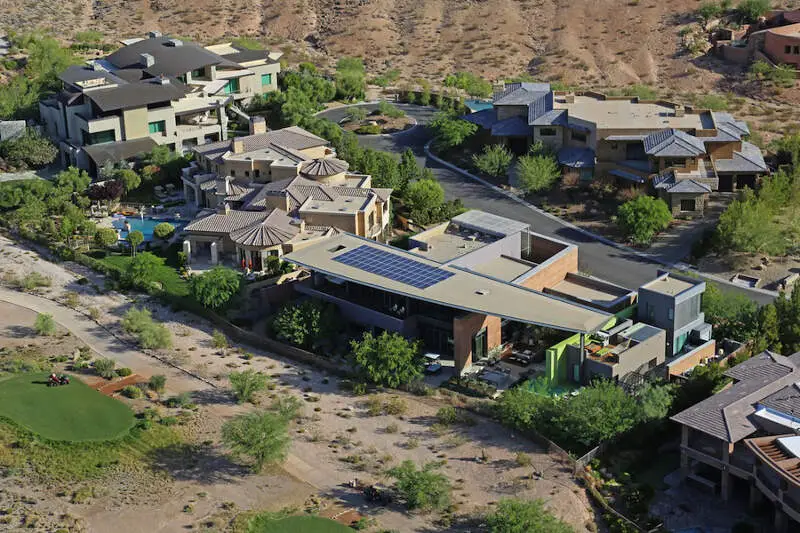
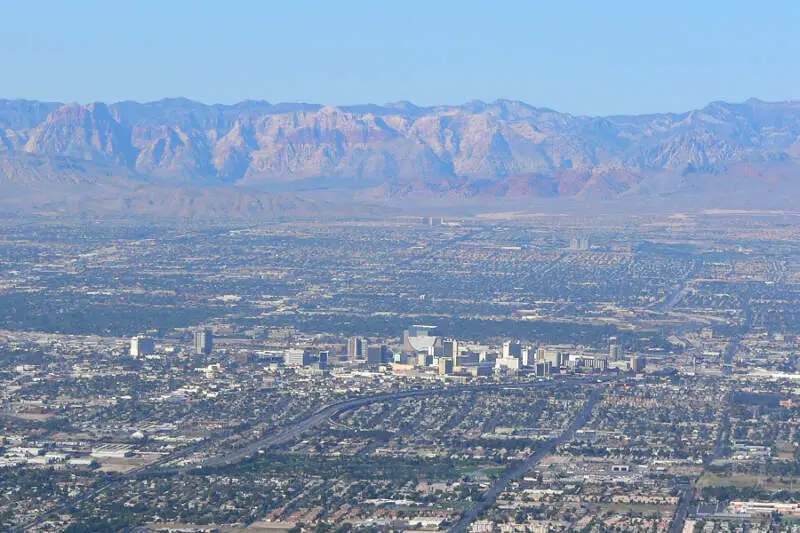
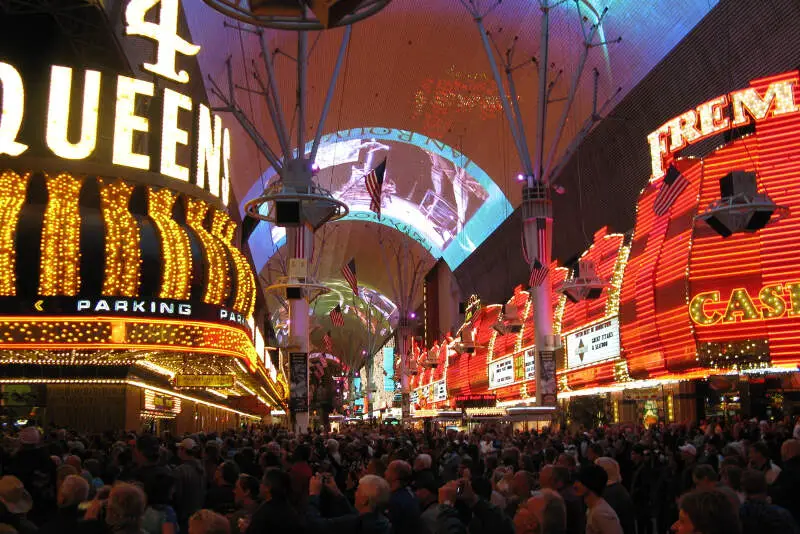
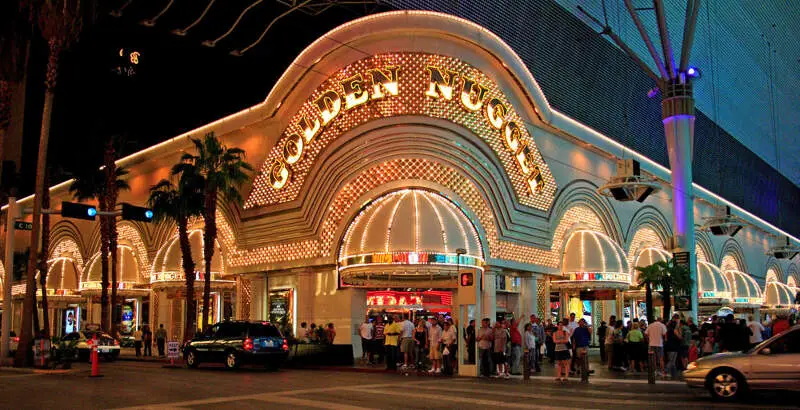
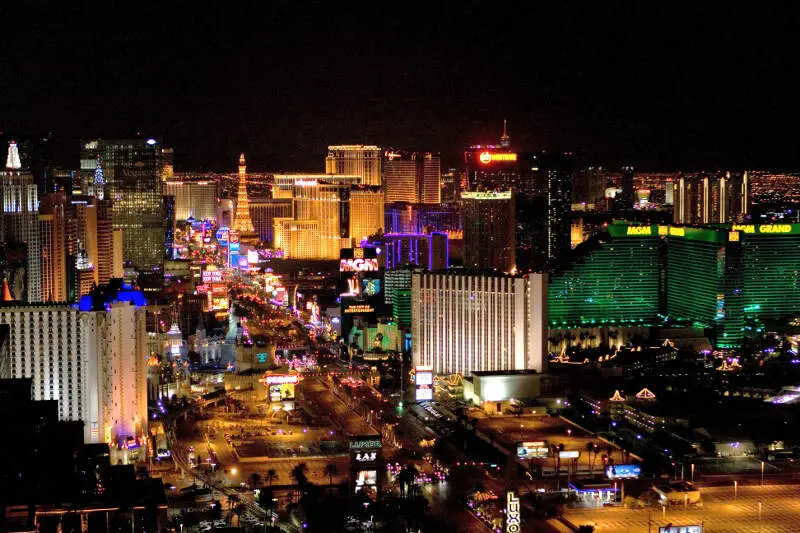
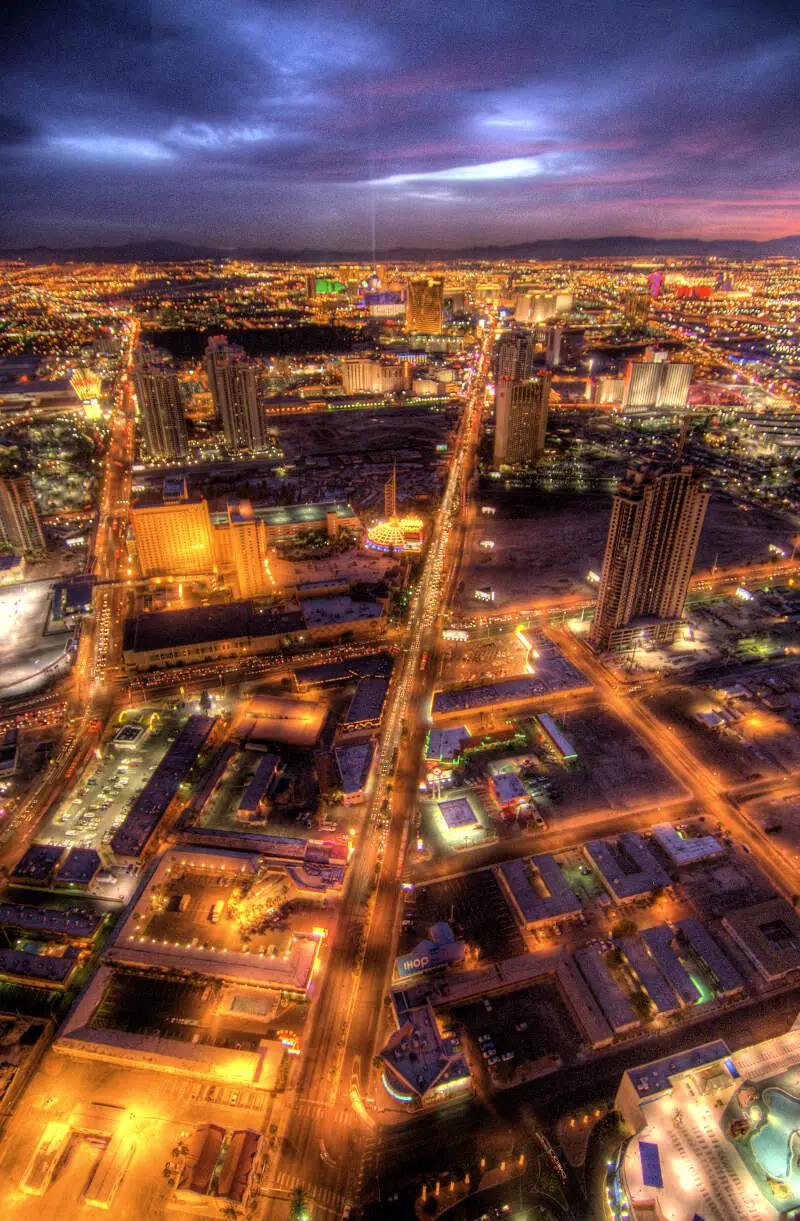
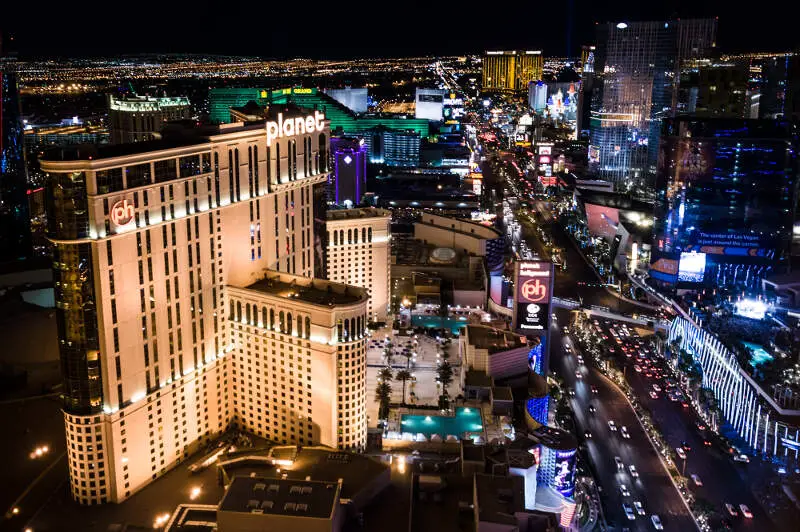
Las Vegas, NV Photos

23 Reviews & Comments About Las Vegas

I live in Las Vegas, Nevada. I'm gonna say that there are scorching hot summers, Mexican migrant workers, and the gun crime. So many homicides already in April.
Nevada isn't bad it's nice where I live in las vegas
I loved being in Las Vegas.
I do not know about the crime, I was on vacation, nothing happened while I was there. But I am sure that crime happens everyday.
Something that is very prevelant is homeless people.
Prostitution is also everywhere you turn.
The Belagio water fountain show was amazing to watch. That was my favorite when it was played to G*d Bless the USA.
The insides of all the casino's were beautiful.
The bad things were just seeing all the homeless people everywhere you turned around.
I love Las Vegas! It will always be home to me. It's easy to find a job in various markets here. The housing even though it's rising, is still more affordable than most places. This is the city that never sleeps, so no matter how late or early it is you can find a grocery store that's open, a fast place to grab a quick bite, a liquor store for those crazy nights with friends, a hospital or urgent care in case of emergencies, 24/7 wedding chapels, endless entertainment, a ton of parks, surrounding mountains, pools, bbq pits, basketball courts, casinos, cannabis shops, water parks, etc.
My favorite places include: In and Out, The Fashion Show Mall, The T-Mobile Arena, The Area 51's Baseball Games, Town Square, Green Valley Ranch Hotel & Casino, Henderson Multi generational Pool, Cowabunga Bay, The High Roller, The Mob Museum, The Mermaid Aquarium at The Silverton, Rum Runners Bar & Grill, The Chicken Shack, Hot & Juicy, Sushi Twister, Osaka, Michael's craft store, The Premium Outlet Mall.
I found minimal fears for personal safety in Las Vegas. For sure there is crime there, but it is not glaring and obvious, as is the case in some decaying eastern cities like Detroit. The city has an efficient and well-maintained police force.
In Las Vegas, everyone's favorite area is The fabulous "Strip" of extravagant gambling casinos. One need really go nowhere else in Las Vegas to experience the trip of a lifetime-it's all there. The only caveat about Las Vegas is that if you win, don't get greedy, and if you lose, know when to quit.
I love how lively and beautiful and active las Vegas is, its a nice place to visit.
It is a great place to visit with many shops and stores, but a lot of bad things to get into.
Overall Las Vegas is a great city to live in. The crime is a problem in certain areas. You have to always keep an eye out on everything, but I feel like that's a great thing to do no matter what city you're in. The schools are over crowded and the district is desperate for teachers. The weather is great, it's hot but there are very few natural disasters that will wipe anything out here.
Honestly if you live her you don't go onto the strip much. There are locals casinos that have buffets and give discounts, so,any people spend time there. They've got movie theaters, bowling alleys, some have malls next to them. I would avoid the strip. It's a huge tourist trap and very hard to navigate. You'll be stuck in traffic forever.
I love vacationing in Las Vegas. I've always stayed on the strip, but have had many excursions and experiences off the strip as well. I've hiked in the canyons and seen some breathtaking views, then gone to Mt. Charleston and seen even more than I had even imagined was there. I've always felt safe in my ventures there and have never had a bad experience when being there.
The entertainment you can find at any of the casinos is amazing. The free shows they put on, or the ones you have to purchase a ticket for never disappoint. I love how the strip feels like it is it's own little city, and each casino offers a completely different theme and experience.
Awesome place to visit. Fabulous shows, celebrity chef-owned restaurants, glitzy casinos, swanky shops, people-watching--so much to see and do!
There's so much wonderful art to see for free by just visiting various casinos. There's observatories at the Bellagio and the Wynn, there's wonderful architecture, art installations at the Venetian, the Aria...I feel like each time we visit, I find a new hidden gem.
There are a ton of things to do, and walking on the strip felt very safe. People were polite, and there were a lot of interesting sites to visit.
My favorite thing was the aquarium at Mandalay Bay casino. It has a touch pool where you can pet manta rays.
So 10 years ago our family decided that is was time to move and we chose Las Vegas as our new home. Coming from California we noticed many differences and similarities. Now here we are 10 years later happy to call this city home.
We moved in the month of June and the very first thing we noticed was the HOT Vegas heat. At over 110 F it took us a while to get used to it, but other than that we were actually very happy and excited about our new home. From the job opportunities to the beautiful mountains we quickly adapted an made this city our home.
Crime I would say is about the same as everywhere else, it happens everywhere. So far the school my kids have gone to have been good, though Nevada is rated low on education. I would recommend las vegas.
I would say my favorite places to go is to the mountains when it snows or even just to hike. The lake is also a good option. The casinos are just a small part of vegas. I would just say to be careful who you talk to here. You just never know.
I love to vacation in Las Vegas. I love the mix of people and most are friendly and welcoming.
I love the diversity of this town.
I love Las Vegas when visiting there was hardly any crime I witnessed while there. The people I came across was friendly and helpful. I enjoyed the different types of communities I visited.
The Las Vegas strip stood out for me because there was so many people, bright lights of the hotels, and so many things to see and places to go visit.
Las Vegas is an interesting place to visit. Many people go to this place to be able to let loose of their morals which might make it a bit dangerous. Personally I really enjoy the nightlife, casinos and drinking. Great place to go unwind and make new friends.
There was always somethibg happening. Be it a morning buffet or late night show. We did not have a dull moment.
There are many places to visit, hotels and many tours that will make you experience significant
I love las vegas because in that city people feel free and we spent fantastic days knowing all their attractions
I love living here. The traffic is not bad at all. The transportation system is fast, easy and on time. People here are generally happy and the city has a relaxed vibe. There are slot machines and casinos everywhere. There is no shortage of fun activities to do.
Casinos, bars, clubs are everywhere! There is always something to do here
Las Vegas is a cool place where there is always something interesting to do, often for not a lot of money. Whether you like food, music, sports, or whatever, Vegas really does have it all. I enjoyed my time in Vegas immensely and visit as often as I'm able.
the sheer amount of things to do is what stands out most to me. You could do something cool every day for as long as you're there and never repeat the experiences.
I love this city because it has great attractions, big mall, and the casinos are endless. The strip is a must see.
When I went outside my hotel room they had a gondola ride right outside of it. My wife and I enjoyed it so much.
I think its a nice place to raise a family and they aren't racist there.
its scenery and a lot of nice people and housing also.
While crime is a bit higher here, but I love all the shopping, food, and energy. I love the faster lifestyle and the weather is amazing! It's a wonderful dry heat and it's warm pretty much year round. There are endless possibilities in Sin City.
My favorite place is on the strip! I love people watching and being able to walk around with a drink in my hand everywhere I go. One thing to watch out for is the sales tax. The city of Las Vegas gets double taxed by Clark County and something else so it's pretty high compared to other states.
SENIOR HOUSING AUTHORITY LIW INCOME
CLEANLINESS& FRIENDLY
Crime is bad. Schools are bad. Nothing to do here. Lad vegas has the strip and once you have seen it you have SEEN it. People think they are safe down there but they are not. Lived here 20 years and we are moving! Not letting my youngest go to highschool here! Education is not a priority but building a stadium is! Pathetic.
Crime bad
Schools bad
Traffic bad
Rude people
Nothing good to say
Rankings & Articles For Las Vegas


Locations Around Las Vegas
Map Of Las Vegas, NV
Best Places Around Las Vegas
Summerlin South, NV
Population 31,354
Henderson, NV
Population 332,141
Enterprise, NV
Population 240,464
Spring Valley, NV
Population 219,187
North Las Vegas, NV
Population 278,595
Winchester, NV
Population 37,081
Whitney, NV
Population 47,221
Paradise, NV
Population 185,913
Sunrise Manor, NV
Population 200,218
Las Vegas Demographics And Statistics
Population over time in Las Vegas
The current population in Las Vegas is 660,400. The population has increased 13.9% from 2010.
| Year | Population | % Change |
|---|---|---|
| 2024 | 660,400 | 1.5% |
| 2023 | 650,873 | 0.9% |
| 2022 | 644,835 | 1.6% |
| 2021 | 634,786 | -1.5% |
| 2020 | 644,594 | 1.5% |
| 2019 | 634,773 | 1.3% |
| 2018 | 626,637 | 0.8% |
| 2017 | 621,662 | 1.4% |
| 2016 | 613,295 | 1.4% |
| 2015 | 605,097 | 1.3% |
| 2014 | 597,353 | 1.0% |
| 2013 | 591,496 | 0.6% |
| 2012 | 587,699 | 0.6% |
| 2011 | 584,413 | 0.8% |
| 2010 | 579,786 | - |
Race / Ethnicity in Las Vegas
See the full breakdown
Las Vegas is:
39.7% White with 261,965 White residents.
11.2% African American with 74,082 African American residents.
0.3% American Indian with 1,715 American Indian residents.
7.0% Asian with 46,204 Asian residents.
0.6% Hawaiian with 3,844 Hawaiian residents.
0.7% Other with 4,566 Other residents.
5.9% Two Or More with 39,161 Two Or More residents.
34.7% Hispanic with 228,863 Hispanic residents.
| Race | Las Vegas | NV | USA |
|---|---|---|---|
| White | 39.7% | 44.8% | 57.4% |
| African American | 11.2% | 9.0% | 11.9% |
| American Indian | 0.3% | 0.6% | 0.5% |
| Asian | 7.0% | 8.8% | 5.9% |
| Hawaiian | 0.6% | 0.7% | 0.2% |
| Other | 0.7% | 0.6% | 0.6% |
| Two Or More | 5.9% | 6.0% | 4.3% |
| Hispanic | 34.7% | 29.6% | 19.3% |
Gender in Las Vegas
See the full breakdown
Las Vegas is 50.2% female with 331,816 female residents.
Las Vegas is 49.8% male with 328,584 male residents.
| Gender | Las Vegas | NV | USA |
|---|---|---|---|
| Female | 50.2% | 49.6% | 50.5% |
| Male | 49.8% | 50.4% | 49.5% |
Highest level of educational attainment in Las Vegas for adults over 25
See the full breakdown
6.0% of adults in Las Vegas completed < 9th grade.
8.0% of adults in Las Vegas completed 9-12th grade.
27.0% of adults in Las Vegas completed high school / ged.
23.0% of adults in Las Vegas completed some college.
8.0% of adults in Las Vegas completed associate's degree.
18.0% of adults in Las Vegas completed bachelor's degree.
7.0% of adults in Las Vegas completed master's degree.
2.0% of adults in Las Vegas completed professional degree.
1.0% of adults in Las Vegas completed doctorate degree.
| Education | Las Vegas | NV | USA |
|---|---|---|---|
| < 9th Grade | 6.0% | 5.0% | 4.0% |
| 9-12th Grade | 8.0% | 7.0% | 6.0% |
| High School / GED | 27.0% | 28.0% | 26.0% |
| Some College | 23.0% | 23.0% | 19.0% |
| Associate's Degree | 8.0% | 9.0% | 9.0% |
| Bachelor's Degree | 18.0% | 18.0% | 22.0% |
| Master's Degree | 7.0% | 7.0% | 10.0% |
| Professional Degree | 2.0% | 2.0% | 2.0% |
| Doctorate Degree | 1.0% | 1.0% | 2.0% |
Household Income For Las Vegas, Nevada
See the full breakdown
5.8% of households in Las Vegas earn Less than $10,000.
3.1% of households in Las Vegas earn $10,000 to $14,999.
6.5% of households in Las Vegas earn $15,000 to $24,999.
7.5% of households in Las Vegas earn $25,000 to $34,999.
11.1% of households in Las Vegas earn $35,000 to $49,999.
16.7% of households in Las Vegas earn $50,000 to $74,999.
13.2% of households in Las Vegas earn $75,000 to $99,999.
17.0% of households in Las Vegas earn $100,000 to $149,999.
8.3% of households in Las Vegas earn $150,000 to $199,999.
10.7% of households in Las Vegas earn $200,000 or more.
| Income | Las Vegas | NV | USA |
|---|---|---|---|
| Less than $10,000 | 5.8% | 5.4% | 5.0% |
| $10,000 to $14,999 | 3.1% | 2.6% | 3.4% |
| $15,000 to $24,999 | 6.5% | 5.9% | 6.3% |
| $25,000 to $34,999 | 7.5% | 6.9% | 6.6% |
| $35,000 to $49,999 | 11.1% | 10.8% | 10.1% |
| $50,000 to $74,999 | 16.7% | 16.5% | 15.5% |
| $75,000 to $99,999 | 13.2% | 13.5% | 12.6% |
| $100,000 to $149,999 | 17.0% | 18.2% | 17.5% |
| $150,000 to $199,999 | 8.3% | 9.3% | 9.6% |
| $200,000 or more | 10.7% | 10.9% | 13.4% |
Source: U.S. Census ACS 5-year estimates (2024)


