Compare Henderson to…
Henderson SnackAbility
Overall SnackAbility
Crime in Henderson summary. We use data from the FBI to determine the crime rates in Henderson. Key points include:
There were 6,829 total crimes in Henderson in the last reporting year.
The overall crime rate per 100,000 people in Henderson is 1,987.4 / 100k people.
The violent crime rate per 100,000 people in Henderson is 272.4 / 100k people.
The property crime rate per 100,000 people in Henderson is 1,715.0 / 100k people.
Overall, crime in Henderson is -6.22% below the national average.
Total Crimes
Below National Average
Crime In Henderson Comparison Table
| Statistic | Count Raw |
Henderson / 100k People |
Nevada / 100k People |
National / 100k People |
|---|---|---|---|---|
| Total Crimes Per 100K | 6,829 | 1,987.4 | 2,599.0 | 2,119.2 |
| Violent Crime | 936 | 272.4 | 402.0 | 359.0 |
| Murder | 8 | 2.3 | 6.1 | 5.0 |
| Robbery | 180 | 52.4 | 63.1 | 61.0 |
| Aggravated Assault | 641 | 186.5 | 281.0 | 256.0 |
| Property Crime | 5,893 | 1,715.0 | 2,197.0 | 1,760.0 |
| Burglary | 778 | 226.4 | 364.4 | 229.0 |
| Larceny | 3,870 | 1,126.2 | 1,357.2 | 1,272.0 |
| Car Theft | 1,245 | 362.3 | 475.4 | 259.0 |
Source: FBI Uniform Crime Reporting (2024)
Cost of living in Henderson summary. We use data on the cost of living to determine how expensive it is to live in Henderson. Real estate prices drive most of the variance in cost of living around Nevada. Key points include:
The cost of living in Henderson is 127 with 100 being average.
The cost of living in Henderson is 1.3x higher than the national average.
The median home value in Henderson is $486,156.
The median income in Henderson is $90,138.
Henderson's Overall Cost Of Living
Higher Than The National Average
Cost Of Living In Henderson Comparison Table
| Living Expense | Henderson | Nevada | National Average |
|---|---|---|---|
| Overall | 127 | 105 | 100 |
| Services | 105 | 103 | 100 |
| Groceries | 102 | 102 | 100 |
| Health | 174 | 101 | 100 |
| Housing | 102 | 102 | 100 |
| Transportation | 111 | 109 | 100 |
| Utilities | 110 | 103 | 100 |
Source: Cost of living index, normalized to US average = 100
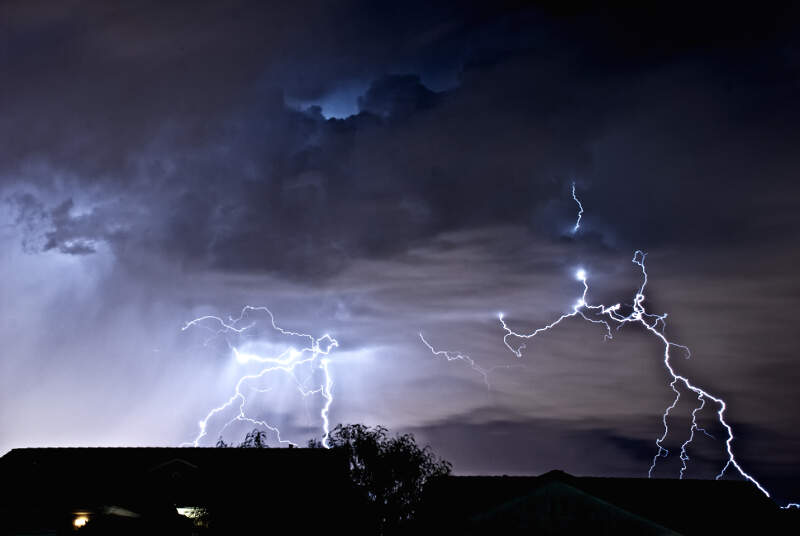
Henderson, NV Weather
The average high in Henderson is 80.4° and the average low is 55.3°.
There are 12.5 days of precipitation each year.
Expect an average of 5.0 inches of precipitation each year with 0.2 inches of snow.
| Stat | Henderson |
|---|---|
| Average Annual High | 80.4 |
| Average Annual Low | 55.3 |
| Annual Precipitation Days | 12.5 |
| Average Annual Precipitation | 5.0 |
| Average Annual Snowfall | 0.2 |
Average High
Days of Rain
Source: NOAA climate normals (30-year)
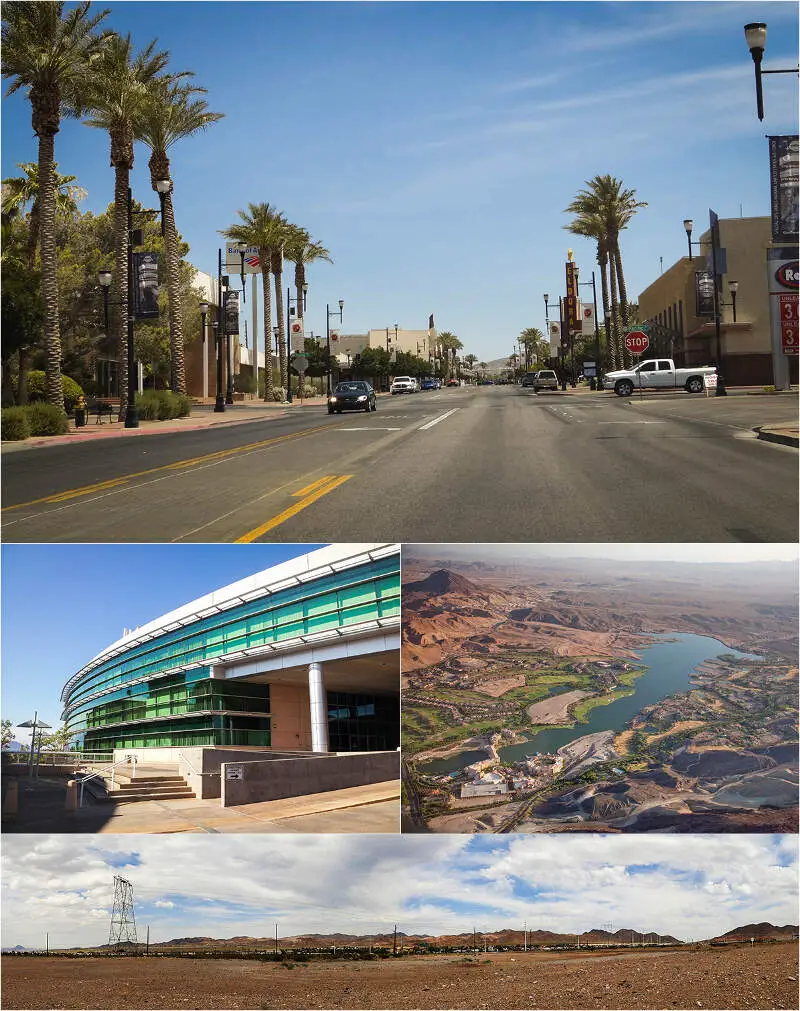
Henderson, NV Photos
2 Reviews & Comments About Henderson

I love visiting Henderson with my family. There are so many choices for shopping and dining. It is near the hustle and bustle of Las Vegas, but since it is on the outskirts, it is chill.
Favorite Henderson places for lunch include The Cheesecake Factory at Green Valley and In-N-Out burger on Eastern. Pick up designer cupcakes at The Cupcakery also on Eastern. Grab your healthy food choices at Trader Joes on Eastern. For clothing, teens love Rapsodielle on Stephanie Street across from the old Toys R Us.
I lived in Las Vegas and moved to Henderson first week our cars were broken into. Lived there 2 1/2 yrs had things stolen 3x. Moved back to Vegas we're we never had a problem.
Rankings & Articles For Henderson


Locations Around Henderson
Map Of Henderson, NV
Best Places Around Henderson
Summerlin South, NV
Population 31,354
Enterprise, NV
Population 240,464
Spring Valley, NV
Population 219,187
Las Vegas, NV
Population 660,400
North Las Vegas, NV
Population 278,595
Winchester, NV
Population 37,081
Whitney, NV
Population 47,221
Paradise, NV
Population 185,913
Sunrise Manor, NV
Population 200,218
Henderson Demographics And Statistics
Population over time in Henderson
The current population in Henderson is 332,141. The population has increased 33.3% from 2010.
| Year | Population | % Change |
|---|---|---|
| 2024 | 332,141 | 2.3% |
| 2023 | 324,523 | 2.0% |
| 2022 | 318,063 | 2.2% |
| 2021 | 311,250 | 0.4% |
| 2020 | 309,955 | 3.3% |
| 2019 | 300,116 | 3.0% |
| 2018 | 291,346 | 2.3% |
| 2017 | 284,817 | 2.5% |
| 2016 | 277,872 | 2.3% |
| 2015 | 271,725 | 2.1% |
| 2014 | 266,245 | 1.6% |
| 2013 | 261,953 | 1.4% |
| 2012 | 258,270 | 1.7% |
| 2011 | 254,055 | 1.9% |
| 2010 | 249,250 | - |
Race / Ethnicity in Henderson
See the full breakdown
Henderson is:
57.5% White with 190,964 White residents.
6.5% African American with 21,568 African American residents.
0.4% American Indian with 1,261 American Indian residents.
9.5% Asian with 31,618 Asian residents.
0.6% Hawaiian with 2,046 Hawaiian residents.
0.8% Other with 2,696 Other residents.
6.5% Two Or More with 21,705 Two Or More residents.
18.1% Hispanic with 60,283 Hispanic residents.
| Race | Henderson | NV | USA |
|---|---|---|---|
| White | 57.5% | 44.8% | 57.4% |
| African American | 6.5% | 9.0% | 11.9% |
| American Indian | 0.4% | 0.6% | 0.5% |
| Asian | 9.5% | 8.8% | 5.9% |
| Hawaiian | 0.6% | 0.7% | 0.2% |
| Other | 0.8% | 0.6% | 0.6% |
| Two Or More | 6.5% | 6.0% | 4.3% |
| Hispanic | 18.1% | 29.6% | 19.3% |
Gender in Henderson
See the full breakdown
Henderson is 50.6% female with 168,138 female residents.
Henderson is 49.4% male with 164,003 male residents.
| Gender | Henderson | NV | USA |
|---|---|---|---|
| Female | 50.6% | 49.6% | 50.5% |
| Male | 49.4% | 50.4% | 49.5% |
Highest level of educational attainment in Henderson for adults over 25
See the full breakdown
3.0% of adults in Henderson completed < 9th grade.
4.0% of adults in Henderson completed 9-12th grade.
23.0% of adults in Henderson completed high school / ged.
24.0% of adults in Henderson completed some college.
9.0% of adults in Henderson completed associate's degree.
23.0% of adults in Henderson completed bachelor's degree.
9.0% of adults in Henderson completed master's degree.
3.0% of adults in Henderson completed professional degree.
2.0% of adults in Henderson completed doctorate degree.
| Education | Henderson | NV | USA |
|---|---|---|---|
| < 9th Grade | 3.0% | 5.0% | 4.0% |
| 9-12th Grade | 4.0% | 7.0% | 6.0% |
| High School / GED | 23.0% | 28.0% | 26.0% |
| Some College | 24.0% | 23.0% | 19.0% |
| Associate's Degree | 9.0% | 9.0% | 9.0% |
| Bachelor's Degree | 23.0% | 18.0% | 22.0% |
| Master's Degree | 9.0% | 7.0% | 10.0% |
| Professional Degree | 3.0% | 2.0% | 2.0% |
| Doctorate Degree | 2.0% | 1.0% | 2.0% |
Household Income For Henderson, Nevada
See the full breakdown
4.4% of households in Henderson earn Less than $10,000.
1.9% of households in Henderson earn $10,000 to $14,999.
5.2% of households in Henderson earn $15,000 to $24,999.
5.2% of households in Henderson earn $25,000 to $34,999.
9.4% of households in Henderson earn $35,000 to $49,999.
15.0% of households in Henderson earn $50,000 to $74,999.
13.6% of households in Henderson earn $75,000 to $99,999.
18.6% of households in Henderson earn $100,000 to $149,999.
11.5% of households in Henderson earn $150,000 to $199,999.
15.1% of households in Henderson earn $200,000 or more.
| Income | Henderson | NV | USA |
|---|---|---|---|
| Less than $10,000 | 4.4% | 5.4% | 5.0% |
| $10,000 to $14,999 | 1.9% | 2.6% | 3.4% |
| $15,000 to $24,999 | 5.2% | 5.9% | 6.3% |
| $25,000 to $34,999 | 5.2% | 6.9% | 6.6% |
| $35,000 to $49,999 | 9.4% | 10.8% | 10.1% |
| $50,000 to $74,999 | 15.0% | 16.5% | 15.5% |
| $75,000 to $99,999 | 13.6% | 13.5% | 12.6% |
| $100,000 to $149,999 | 18.6% | 18.2% | 17.5% |
| $150,000 to $199,999 | 11.5% | 9.3% | 9.6% |
| $200,000 or more | 15.1% | 10.9% | 13.4% |
Source: U.S. Census ACS 5-year estimates (2024)


