Compare North Las Vegas to…
North Las Vegas SnackAbility
Overall SnackAbility
Crime in North Las Vegas summary. We use data from the FBI to determine the crime rates in North Las Vegas. Key points include:
There were 6,889 total crimes in North Las Vegas in the last reporting year.
The overall crime rate per 100,000 people in North Las Vegas is 2,350.4 / 100k people.
The violent crime rate per 100,000 people in North Las Vegas is 388.9 / 100k people.
The property crime rate per 100,000 people in North Las Vegas is 1,961.4 / 100k people.
Overall, crime in North Las Vegas is 10.91% above the national average.
Total Crimes
Above National Average
Crime In North Las Vegas Comparison Table
| Statistic | Count Raw |
North Las Vegas / 100k People |
Nevada / 100k People |
National / 100k People |
|---|---|---|---|---|
| Total Crimes Per 100K | 6,889 | 2,350.4 | 2,599.0 | 2,119.2 |
| Violent Crime | 1,140 | 388.9 | 402.0 | 359.0 |
| Murder | 35 | 11.9 | 6.1 | 5.0 |
| Robbery | 329 | 112.2 | 63.1 | 61.0 |
| Aggravated Assault | 679 | 231.7 | 281.0 | 256.0 |
| Property Crime | 5,749 | 1,961.4 | 2,197.0 | 1,760.0 |
| Burglary | 959 | 327.2 | 364.4 | 229.0 |
| Larceny | 2,737 | 933.8 | 1,357.2 | 1,272.0 |
| Car Theft | 2,053 | 700.4 | 475.4 | 259.0 |
Source: FBI Uniform Crime Reporting (2024)
Cost of living in North Las Vegas summary. We use data on the cost of living to determine how expensive it is to live in North Las Vegas. Real estate prices drive most of the variance in cost of living around Nevada. Key points include:
The cost of living in North Las Vegas is 115 with 100 being average.
The cost of living in North Las Vegas is 1.1x higher than the national average.
The median home value in North Las Vegas is $407,047.
The median income in North Las Vegas is $79,542.
North Las Vegas's Overall Cost Of Living
Higher Than The National Average
Cost Of Living In North Las Vegas Comparison Table
| Living Expense | North Las Vegas | Nevada | National Average |
|---|---|---|---|
| Overall | 115 | 105 | 100 |
| Services | 103 | 103 | 100 |
| Groceries | 105 | 102 | 100 |
| Health | 139 | 101 | 100 |
| Housing | 100 | 102 | 100 |
| Transportation | 111 | 109 | 100 |
| Utilities | 104 | 103 | 100 |
Source: Cost of living index, normalized to US average = 100
North Las Vegas, NV Weather
The average high in North Las Vegas is 80.8° and the average low is 54.0°.
There are 11.6 days of precipitation each year.
Expect an average of 4.5 inches of precipitation each year with 0.1 inches of snow.
| Stat | North Las Vegas |
|---|---|
| Average Annual High | 80.8 |
| Average Annual Low | 54.0 |
| Annual Precipitation Days | 11.6 |
| Average Annual Precipitation | 4.5 |
| Average Annual Snowfall | 0.1 |
Average High
Days of Rain
Source: NOAA climate normals (30-year)
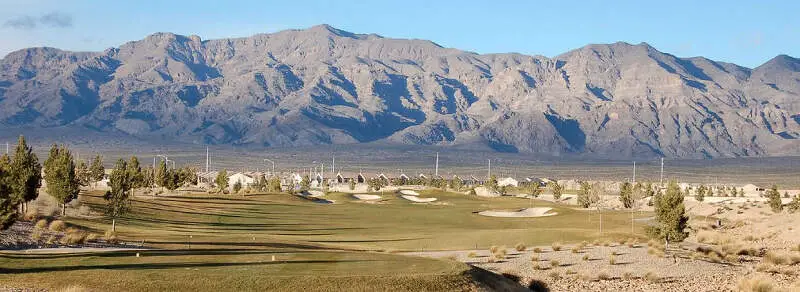
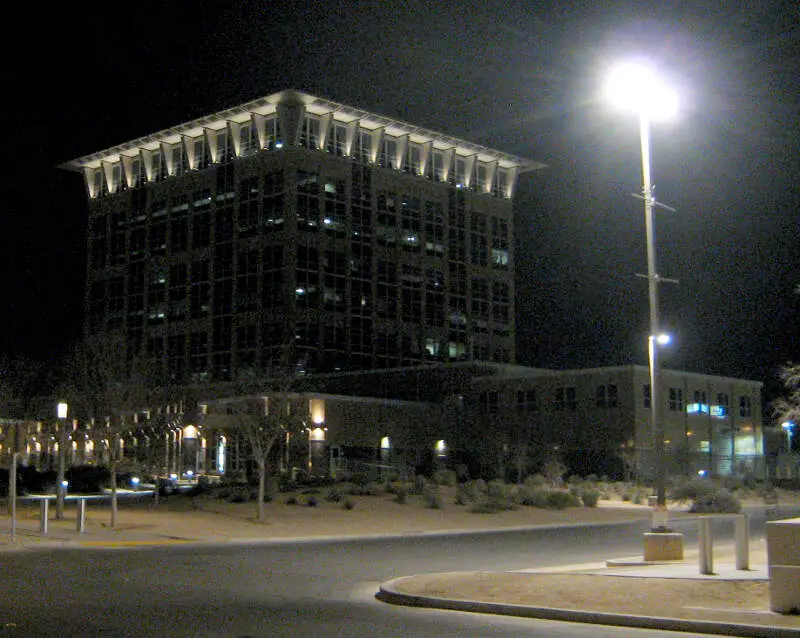
North Las Vegas, NV Photos
Rankings & Articles For North Las Vegas


Locations Around North Las Vegas
Map Of North Las Vegas, NV
Best Places Around North Las Vegas
Summerlin South, NV
Population 31,354
Henderson, NV
Population 332,141
Enterprise, NV
Population 240,464
Spring Valley, NV
Population 219,187
Las Vegas, NV
Population 660,400
Winchester, NV
Population 37,081
Whitney, NV
Population 47,221
Paradise, NV
Population 185,913
Sunrise Manor, NV
Population 200,218
North Las Vegas Demographics And Statistics
Population over time in North Las Vegas
The current population in North Las Vegas is 278,595. The population has increased 36.6% from 2010.
| Year | Population | % Change |
|---|---|---|
| 2024 | 278,595 | 2.9% |
| 2023 | 270,773 | 2.6% |
| 2022 | 264,022 | 1.7% |
| 2021 | 259,638 | 5.0% |
| 2020 | 247,248 | 2.4% |
| 2019 | 241,369 | 1.8% |
| 2018 | 236,986 | 1.1% |
| 2017 | 234,389 | 1.7% |
| 2016 | 230,436 | 1.6% |
| 2015 | 226,860 | 1.6% |
| 2014 | 223,336 | 1.6% |
| 2013 | 219,725 | 1.8% |
| 2012 | 215,762 | 2.5% |
| 2011 | 210,458 | 3.2% |
| 2010 | 203,951 | - |
Race / Ethnicity in North Las Vegas
See the full breakdown
North Las Vegas is:
23.4% White with 65,307 White residents.
20.6% African American with 57,268 African American residents.
0.3% American Indian with 936 American Indian residents.
7.0% Asian with 19,588 Asian residents.
0.9% Hawaiian with 2,432 Hawaiian residents.
0.4% Other with 1,208 Other residents.
5.6% Two Or More with 15,654 Two Or More residents.
41.7% Hispanic with 116,202 Hispanic residents.
| Race | North Las Vegas | NV | USA |
|---|---|---|---|
| White | 23.4% | 44.8% | 57.4% |
| African American | 20.6% | 9.0% | 11.9% |
| American Indian | 0.3% | 0.6% | 0.5% |
| Asian | 7.0% | 8.8% | 5.9% |
| Hawaiian | 0.9% | 0.7% | 0.2% |
| Other | 0.4% | 0.6% | 0.6% |
| Two Or More | 5.6% | 6.0% | 4.3% |
| Hispanic | 41.7% | 29.6% | 19.3% |
Gender in North Las Vegas
See the full breakdown
North Las Vegas is 50.8% female with 141,640 female residents.
North Las Vegas is 49.2% male with 136,955 male residents.
| Gender | North Las Vegas | NV | USA |
|---|---|---|---|
| Female | 50.8% | 49.6% | 50.5% |
| Male | 49.2% | 50.4% | 49.5% |
Highest level of educational attainment in North Las Vegas for adults over 25
See the full breakdown
9.0% of adults in North Las Vegas completed < 9th grade.
8.0% of adults in North Las Vegas completed 9-12th grade.
32.0% of adults in North Las Vegas completed high school / ged.
23.0% of adults in North Las Vegas completed some college.
9.0% of adults in North Las Vegas completed associate's degree.
13.0% of adults in North Las Vegas completed bachelor's degree.
5.0% of adults in North Las Vegas completed master's degree.
1.0% of adults in North Las Vegas completed professional degree.
0.0% of adults in North Las Vegas completed doctorate degree.
| Education | North Las Vegas | NV | USA |
|---|---|---|---|
| < 9th Grade | 9.0% | 5.0% | 4.0% |
| 9-12th Grade | 8.0% | 7.0% | 6.0% |
| High School / GED | 32.0% | 28.0% | 26.0% |
| Some College | 23.0% | 23.0% | 19.0% |
| Associate's Degree | 9.0% | 9.0% | 9.0% |
| Bachelor's Degree | 13.0% | 18.0% | 22.0% |
| Master's Degree | 5.0% | 7.0% | 10.0% |
| Professional Degree | 1.0% | 2.0% | 2.0% |
| Doctorate Degree | 0.0% | 1.0% | 2.0% |
Household Income For North Las Vegas, Nevada
See the full breakdown
4.8% of households in North Las Vegas earn Less than $10,000.
2.6% of households in North Las Vegas earn $10,000 to $14,999.
5.0% of households in North Las Vegas earn $15,000 to $24,999.
6.4% of households in North Las Vegas earn $25,000 to $34,999.
10.9% of households in North Las Vegas earn $35,000 to $49,999.
16.7% of households in North Las Vegas earn $50,000 to $74,999.
15.5% of households in North Las Vegas earn $75,000 to $99,999.
20.8% of households in North Las Vegas earn $100,000 to $149,999.
10.0% of households in North Las Vegas earn $150,000 to $199,999.
7.1% of households in North Las Vegas earn $200,000 or more.
| Income | North Las Vegas | NV | USA |
|---|---|---|---|
| Less than $10,000 | 4.8% | 5.4% | 5.0% |
| $10,000 to $14,999 | 2.6% | 2.6% | 3.4% |
| $15,000 to $24,999 | 5.0% | 5.9% | 6.3% |
| $25,000 to $34,999 | 6.4% | 6.9% | 6.6% |
| $35,000 to $49,999 | 10.9% | 10.8% | 10.1% |
| $50,000 to $74,999 | 16.7% | 16.5% | 15.5% |
| $75,000 to $99,999 | 15.5% | 13.5% | 12.6% |
| $100,000 to $149,999 | 20.8% | 18.2% | 17.5% |
| $150,000 to $199,999 | 10.0% | 9.3% | 9.6% |
| $200,000 or more | 7.1% | 10.9% | 13.4% |
Source: U.S. Census ACS 5-year estimates (2024)


