Biloxi SnackAbility
Overall SnackAbility
Crime in Biloxi summary. We use data from the FBI to determine the crime rates in Biloxi. Key points include:
There were 2,547 total crimes in Biloxi in the last reporting year.
The overall crime rate per 100,000 people in Biloxi is 5,499.1 / 100k people.
The violent crime rate per 100,000 people in Biloxi is 390.8 / 100k people.
The property crime rate per 100,000 people in Biloxi is 5,108.3 / 100k people.
Overall, crime in Biloxi is 159.48% above the national average.
Total Crimes
Above National Average
Crime In Biloxi Comparison Table
| Statistic | Count Raw |
Biloxi / 100k People |
Mississippi / 100k People |
National / 100k People |
|---|---|---|---|---|
| Total Crimes Per 100K | 2,547 | 5,499.1 | 1,573.5 | 2,119.2 |
| Violent Crime | 181 | 390.8 | 210.5 | 359.0 |
| Murder | 5 | 10.8 | 7.4 | 5.0 |
| Robbery | 41 | 88.5 | 18.5 | 61.0 |
| Aggravated Assault | 106 | 228.9 | 155.4 | 256.0 |
| Property Crime | 2,366 | 5,108.3 | 1,363.0 | 1,760.0 |
| Burglary | 609 | 1,314.9 | 235.2 | 229.0 |
| Larceny | 1,557 | 3,361.6 | 982.5 | 1,272.0 |
| Car Theft | 200 | 431.8 | 145.3 | 259.0 |
Source: FBI Uniform Crime Reporting (2024)
Cost of living in Biloxi summary. We use data on the cost of living to determine how expensive it is to live in Biloxi. Real estate prices drive most of the variance in cost of living around Mississippi. Key points include:
The cost of living in Biloxi is 94 with 100 being average.
The cost of living in Biloxi is 0.9x lower than the national average.
The median home value in Biloxi is $232,658.
The median income in Biloxi is $57,204.
Biloxi's Overall Cost Of Living
Lower Than The National Average
Cost Of Living In Biloxi Comparison Table
| Living Expense | Biloxi | Mississippi | National Average |
|---|---|---|---|
| Overall | 94 | 88 | 100 |
| Services | 96 | 99 | 100 |
| Groceries | 98 | 97 | 100 |
| Health | 90 | 63 | 100 |
| Housing | 96 | 94 | 100 |
| Transportation | 98 | 97 | 100 |
| Utilities | 94 | 93 | 100 |
Source: Cost of living index, normalized to US average = 100
Biloxi, MS Weather
The average high in Biloxi is 76.4° and the average low is 59.3°.
There are 77.0 days of precipitation each year.
Expect an average of 64.5 inches of precipitation each year with 0.2 inches of snow.
| Stat | Biloxi |
|---|---|
| Average Annual High | 76.4 |
| Average Annual Low | 59.3 |
| Annual Precipitation Days | 77.0 |
| Average Annual Precipitation | 64.5 |
| Average Annual Snowfall | 0.2 |
Average High
Days of Rain
Source: NOAA climate normals (30-year)
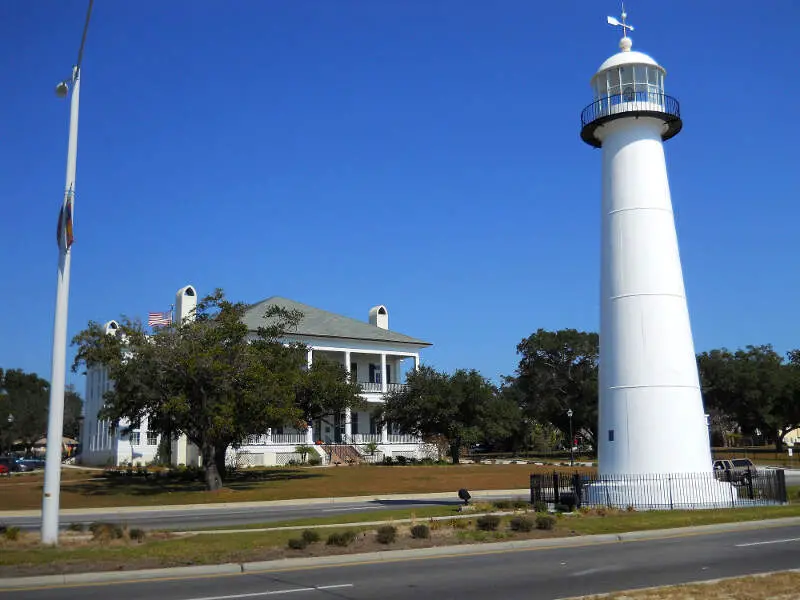
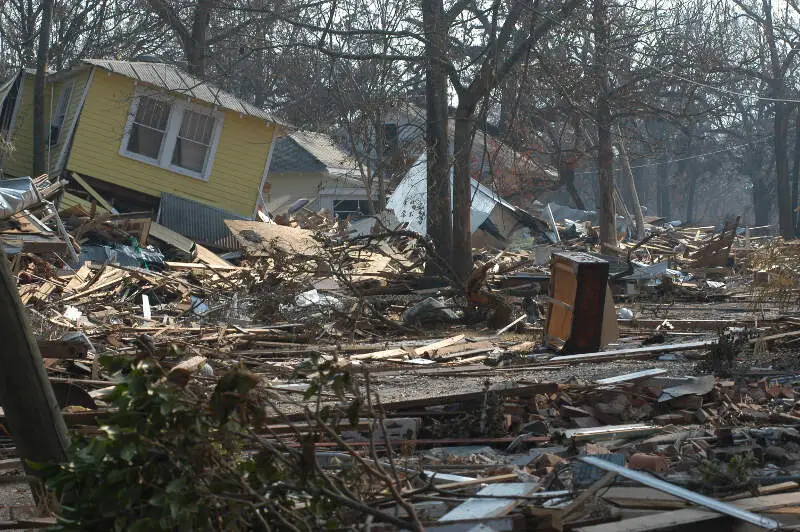
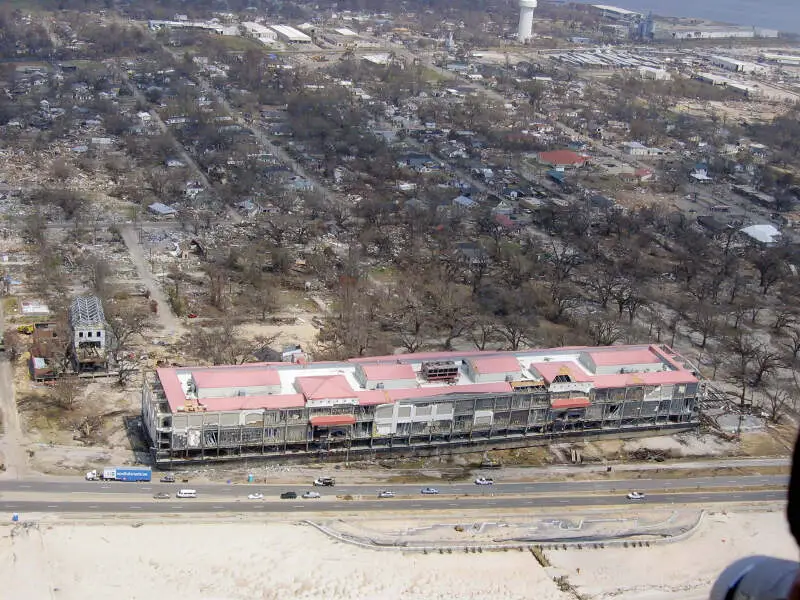
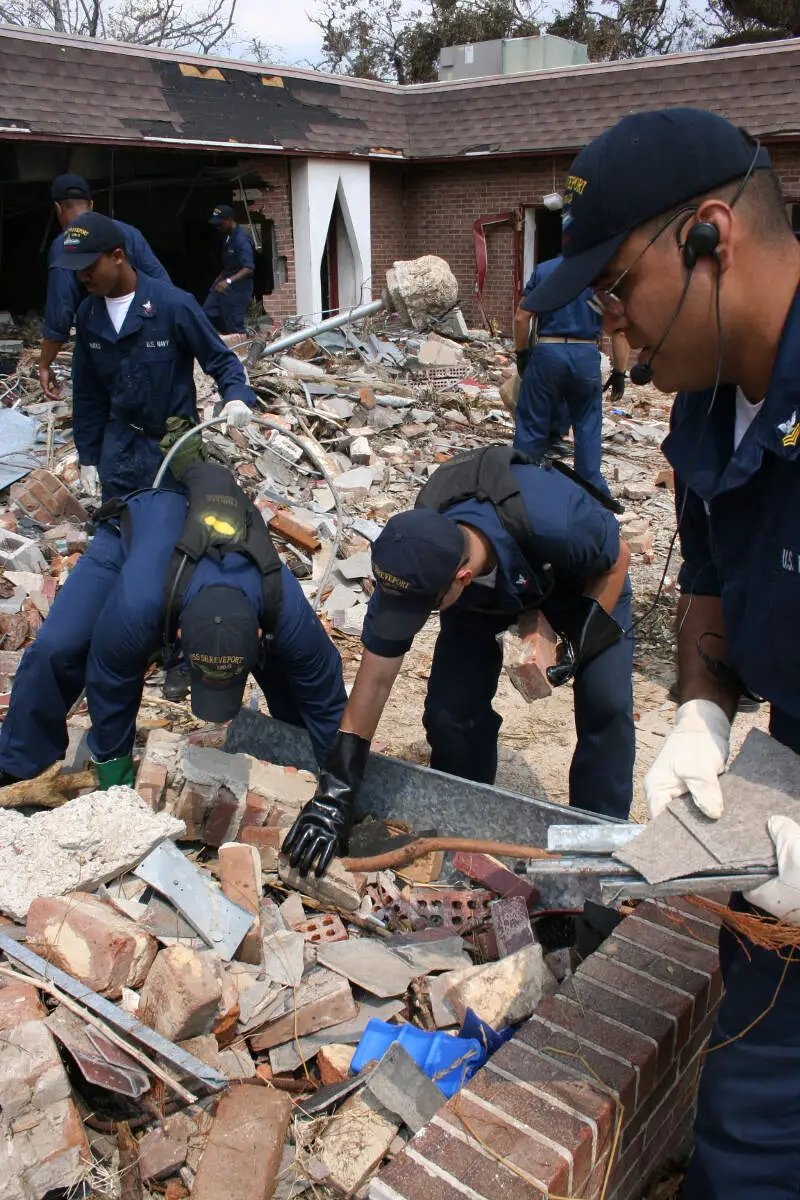
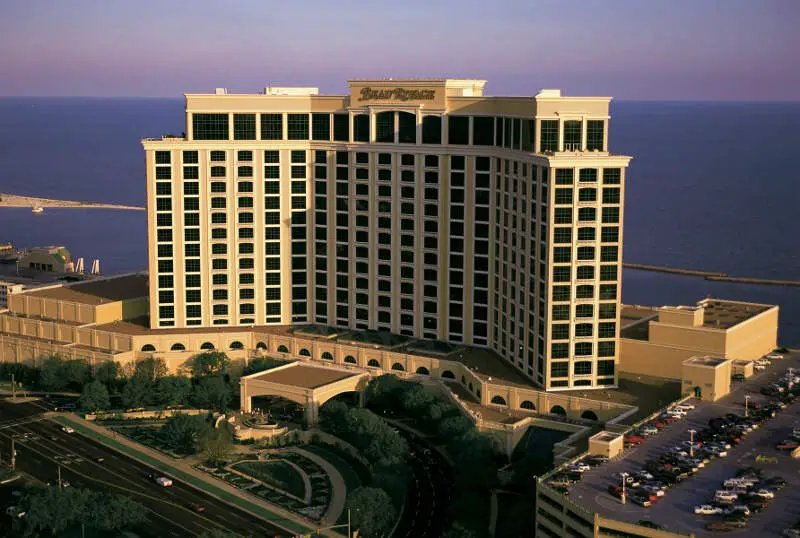
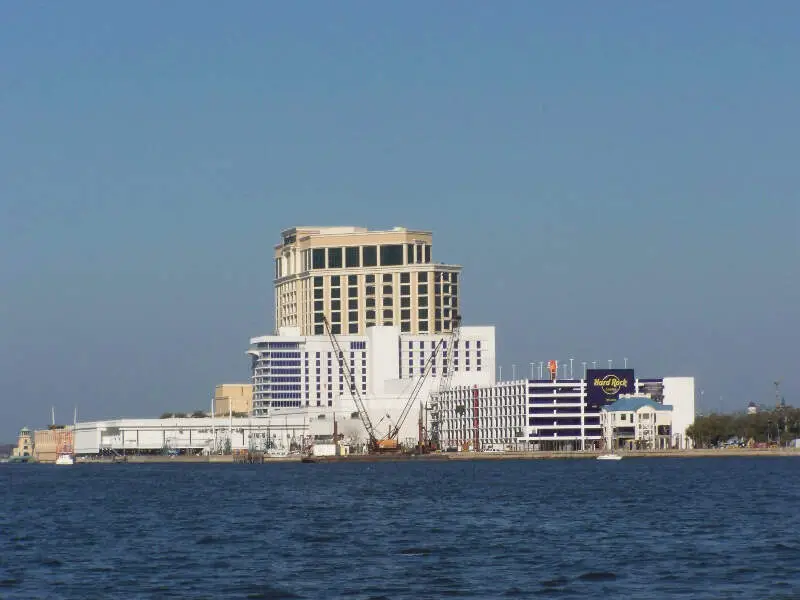
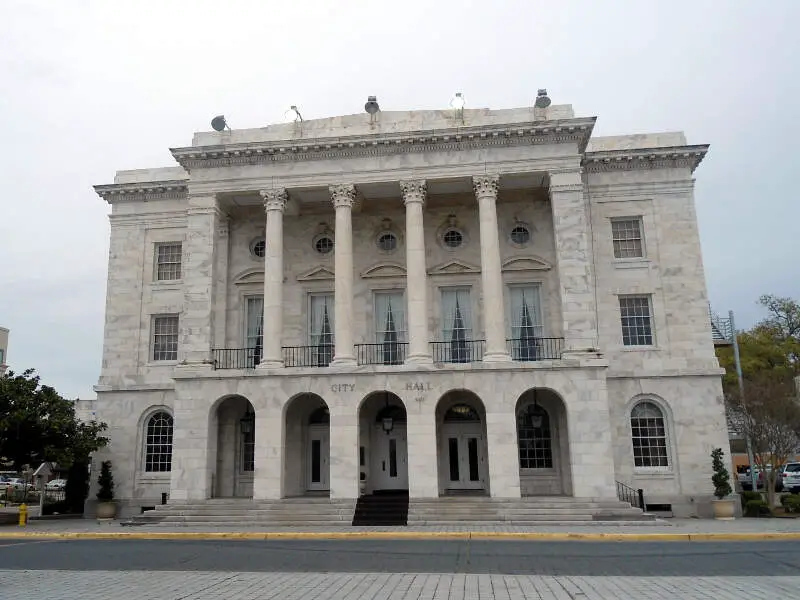
Biloxi, MS Photos


2 Reviews & Comments About Biloxi

Crime rates are horrible and there is always a shooting, stabbing or etc that happens almost daily. The schools are usually crammed pack and the teachers do not watch for our kids when it comes to bullies. Kids have taken their own lives due to this nonsense.
Things I enjoyed were activities: Casinos, restaurants, pool halls, kids learning centers. But the traffic and people in the area are horrible and rude.
I don't feel safe in Biloxi. You can't leave anything in your car. There's a lot of people on drugs down here.
There isn't much to do for fun for kids or adults. There are casinos which is fun if you have the money to just throw away. There aren't any good museums or fun things to do for a date. It's always hot. It's fun to fish but the beaches are very dirty and not safe to go in. People have gotten very sick if they had a cut on them and went in the beach. It's very dangerous
Rankings & Articles For Biloxi


Locations Around Biloxi
Map Of Biloxi, MS
Best Places Around Biloxi
Gulf Hills, MS
Population 8,451
Long Beach, MS
Population 17,009
Ocean Springs, MS
Population 18,646
Gulf Park Estates, MS
Population 6,264
D'Iberville, MS
Population 13,203
Latimer, MS
Population 6,756
St. Martin, MS
Population 8,139
Gautier, MS
Population 19,046
Gulfport, MS
Population 73,003
Biloxi Demographics And Statistics
Population over time in Biloxi
The current population in Biloxi is 48,861. The population has increased 11.2% from 2010.
| Year | Population | % Change |
|---|---|---|
| 2024 | 48,861 | -0.3% |
| 2023 | 49,011 | -0.3% |
| 2022 | 49,141 | 0.2% |
| 2021 | 49,061 | 6.6% |
| 2020 | 46,042 | 0.3% |
| 2019 | 45,906 | 0.7% |
| 2018 | 45,568 | 0.5% |
| 2017 | 45,328 | 0.1% |
| 2016 | 45,271 | 1.0% |
| 2015 | 44,825 | 0.7% |
| 2014 | 44,527 | 0.4% |
| 2013 | 44,354 | 0.3% |
| 2012 | 44,223 | -0.1% |
| 2011 | 44,256 | 0.8% |
| 2010 | 43,921 | - |
Race / Ethnicity in Biloxi
See the full breakdown
Biloxi is:
59.4% White with 29,020 White residents.
18.4% African American with 9,001 African American residents.
0.0% American Indian with 24 American Indian residents.
3.6% Asian with 1,756 Asian residents.
0.1% Hawaiian with 35 Hawaiian residents.
0.7% Other with 318 Other residents.
7.0% Two Or More with 3,416 Two Or More residents.
10.8% Hispanic with 5,291 Hispanic residents.
| Race | Biloxi | MS | USA |
|---|---|---|---|
| White | 59.4% | 55.2% | 57.4% |
| African American | 18.4% | 36.3% | 11.9% |
| American Indian | 0.0% | 0.4% | 0.5% |
| Asian | 3.6% | 1.0% | 5.9% |
| Hawaiian | 0.1% | 0.0% | 0.2% |
| Other | 0.7% | 0.3% | 0.6% |
| Two Or More | 7.0% | 3.0% | 4.3% |
| Hispanic | 10.8% | 3.7% | 19.3% |
Gender in Biloxi
See the full breakdown
Biloxi is 50.3% female with 24,554 female residents.
Biloxi is 49.7% male with 24,307 male residents.
| Gender | Biloxi | MS | USA |
|---|---|---|---|
| Female | 50.3% | 51.5% | 50.5% |
| Male | 49.7% | 48.5% | 49.5% |
Highest level of educational attainment in Biloxi for adults over 25
See the full breakdown
5.0% of adults in Biloxi completed < 9th grade.
6.0% of adults in Biloxi completed 9-12th grade.
24.0% of adults in Biloxi completed high school / ged.
21.0% of adults in Biloxi completed some college.
13.0% of adults in Biloxi completed associate's degree.
19.0% of adults in Biloxi completed bachelor's degree.
9.0% of adults in Biloxi completed master's degree.
2.0% of adults in Biloxi completed professional degree.
1.0% of adults in Biloxi completed doctorate degree.
| Education | Biloxi | MS | USA |
|---|---|---|---|
| < 9th Grade | 5.0% | 4.0% | 4.0% |
| 9-12th Grade | 6.0% | 9.0% | 6.0% |
| High School / GED | 24.0% | 30.0% | 26.0% |
| Some College | 21.0% | 21.0% | 19.0% |
| Associate's Degree | 13.0% | 11.0% | 9.0% |
| Bachelor's Degree | 19.0% | 15.0% | 22.0% |
| Master's Degree | 9.0% | 7.0% | 10.0% |
| Professional Degree | 2.0% | 2.0% | 2.0% |
| Doctorate Degree | 1.0% | 1.0% | 2.0% |
Household Income For Biloxi, Mississippi
See the full breakdown
6.8% of households in Biloxi earn Less than $10,000.
4.9% of households in Biloxi earn $10,000 to $14,999.
9.0% of households in Biloxi earn $15,000 to $24,999.
8.6% of households in Biloxi earn $25,000 to $34,999.
13.1% of households in Biloxi earn $35,000 to $49,999.
18.8% of households in Biloxi earn $50,000 to $74,999.
12.6% of households in Biloxi earn $75,000 to $99,999.
14.2% of households in Biloxi earn $100,000 to $149,999.
5.7% of households in Biloxi earn $150,000 to $199,999.
6.3% of households in Biloxi earn $200,000 or more.
| Income | Biloxi | MS | USA |
|---|---|---|---|
| Less than $10,000 | 6.8% | 7.1% | 5.0% |
| $10,000 to $14,999 | 4.9% | 6.0% | 3.4% |
| $15,000 to $24,999 | 9.0% | 10.0% | 6.3% |
| $25,000 to $34,999 | 8.6% | 9.3% | 6.6% |
| $35,000 to $49,999 | 13.1% | 12.7% | 10.1% |
| $50,000 to $74,999 | 18.8% | 16.5% | 15.5% |
| $75,000 to $99,999 | 12.6% | 12.0% | 12.6% |
| $100,000 to $149,999 | 14.2% | 14.4% | 17.5% |
| $150,000 to $199,999 | 5.7% | 6.2% | 9.6% |
| $200,000 or more | 6.3% | 5.8% | 13.4% |
Source: U.S. Census ACS 5-year estimates (2024)


