Picayune SnackAbility
Overall SnackAbility
Cost of living in Picayune summary. We use data on the cost of living to determine how expensive it is to live in Picayune. Real estate prices drive most of the variance in cost of living around Mississippi. Key points include:
The cost of living in Picayune is 85 with 100 being average.
The cost of living in Picayune is 0.8x lower than the national average.
The median home value in Picayune is $193,808.
The median income in Picayune is $41,213.
Picayune's Overall Cost Of Living
Lower Than The National Average
Cost Of Living In Picayune Comparison Table
| Living Expense | Picayune | Mississippi | National Average |
|---|---|---|---|
| Overall | 85 | 88 | 100 |
| Services | 94 | 99 | 100 |
| Groceries | 94 | 97 | 100 |
| Health | 68 | 63 | 100 |
| Housing | 94 | 94 | 100 |
| Transportation | 99 | 97 | 100 |
| Utilities | 93 | 93 | 100 |
Source: Cost of living index, normalized to US average = 100
Picayune, MS Weather
The average high in Picayune is 77.7° and the average low is 55.7°.
There are 81.4 days of precipitation each year.
Expect an average of 63.4 inches of precipitation each year with 0.0 inches of snow.
| Stat | Picayune |
|---|---|
| Average Annual High | 77.7 |
| Average Annual Low | 55.7 |
| Annual Precipitation Days | 81.4 |
| Average Annual Precipitation | 63.4 |
| Average Annual Snowfall | 0.0 |
Average High
Days of Rain
Source: NOAA climate normals (30-year)
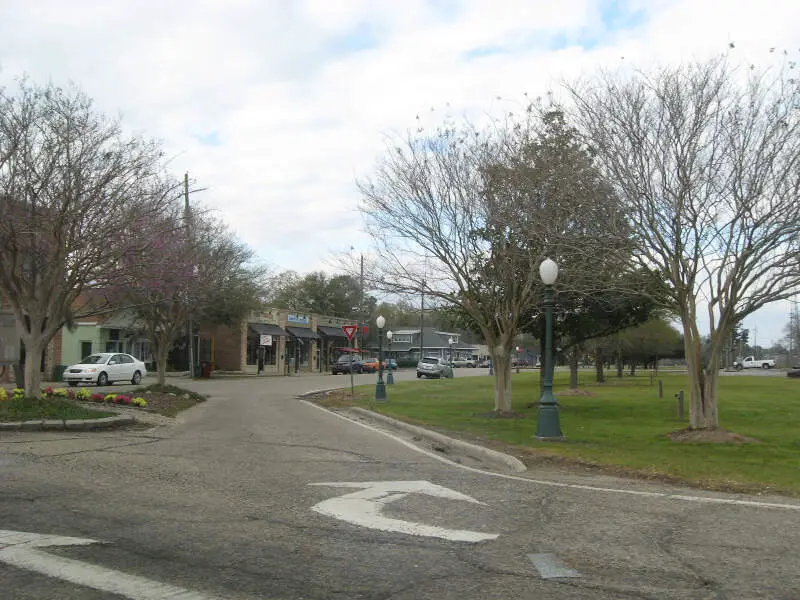
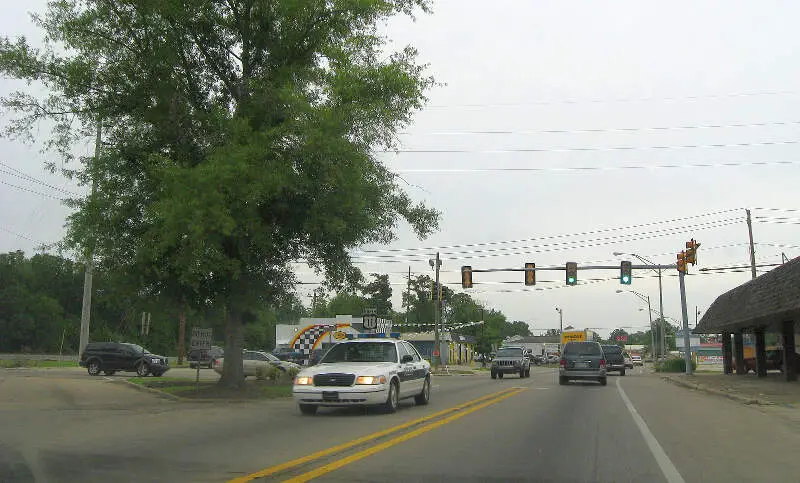
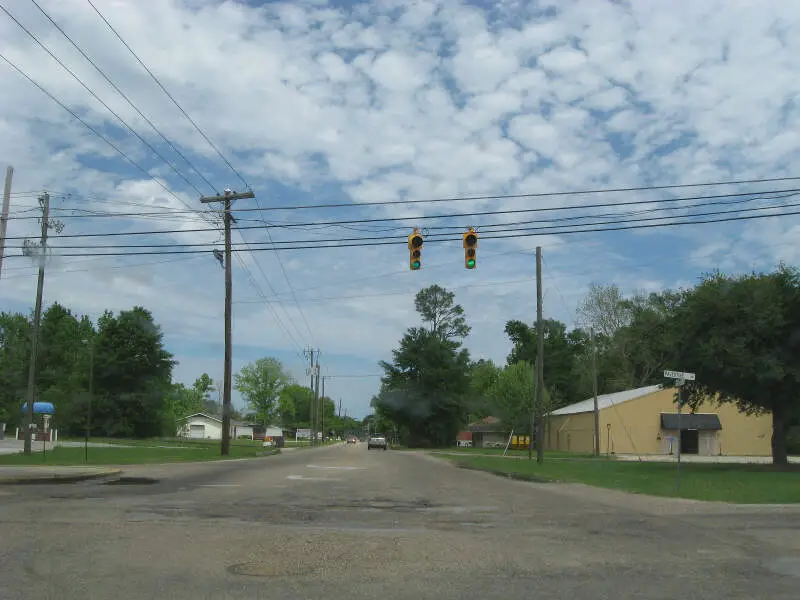
Picayune, MS Photos
2 Reviews & Comments About Picayune

Low crime A+++ schools nice. Neighbors great neighborhood medium income tennis space center available jobs
Retirement community locally owned businesses home grown products
Growing up here I found out how important family is no matter the good or bad that can happen between them.
What stood out to me in Picayune was the involment the community was to all the kids and teenagers. No matter if you were from there or not you would still be protected by the elders. I miss the good ole days.
Rankings & Articles For Picayune


Locations Around Picayune
Map Of Picayune, MS
Best Places Around Picayune
New Orleans, LA
Population 371,853
Bogalusa, LA
Population 10,468
Kenner, LA
Population 64,904
Chalmette, LA
Population 22,616
Metairie, LA
Population 139,729
Violet, LA
Population 4,122
Gretna, LA
Population 17,389
Meraux, LA
Population 7,918
Hammond, LA
Population 21,539
Long Beach, MS
Population 17,009
Picayune Demographics And Statistics
Population over time in Picayune
The current population in Picayune is 11,900. The population has increased 7.3% from 2010.
| Year | Population | % Change |
|---|---|---|
| 2024 | 11,900 | 0.5% |
| 2023 | 11,839 | 0.3% |
| 2022 | 11,804 | 0.2% |
| 2021 | 11,777 | 6.9% |
| 2020 | 11,016 | -0.2% |
| 2019 | 11,040 | -0.9% |
| 2018 | 11,140 | 5.8% |
| 2017 | 10,528 | -1.9% |
| 2016 | 10,732 | -0.5% |
| 2015 | 10,784 | -0.5% |
| 2014 | 10,838 | -0.6% |
| 2013 | 10,901 | -0.7% |
| 2012 | 10,982 | -0.4% |
| 2011 | 11,023 | -0.6% |
| 2010 | 11,087 | - |
Race / Ethnicity in Picayune
See the full breakdown
Picayune is:
52.1% White with 6,197 White residents.
38.5% African American with 4,584 African American residents.
0.0% American Indian with 0 American Indian residents.
0.0% Asian with 0 Asian residents.
0.0% Hawaiian with 0 Hawaiian residents.
0.4% Other with 50 Other residents.
3.9% Two Or More with 466 Two Or More residents.
5.1% Hispanic with 603 Hispanic residents.
| Race | Picayune | MS | USA |
|---|---|---|---|
| White | 52.1% | 55.2% | 57.4% |
| African American | 38.5% | 36.3% | 11.9% |
| American Indian | 0.0% | 0.4% | 0.5% |
| Asian | 0.0% | 1.0% | 5.9% |
| Hawaiian | 0.0% | 0.0% | 0.2% |
| Other | 0.4% | 0.3% | 0.6% |
| Two Or More | 3.9% | 3.0% | 4.3% |
| Hispanic | 5.1% | 3.7% | 19.3% |
Gender in Picayune
See the full breakdown
Picayune is 50.8% female with 6,047 female residents.
Picayune is 49.2% male with 5,852 male residents.
| Gender | Picayune | MS | USA |
|---|---|---|---|
| Female | 50.8% | 51.5% | 50.5% |
| Male | 49.2% | 48.5% | 49.5% |
Highest level of educational attainment in Picayune for adults over 25
See the full breakdown
5.0% of adults in Picayune completed < 9th grade.
7.0% of adults in Picayune completed 9-12th grade.
36.0% of adults in Picayune completed high school / ged.
24.0% of adults in Picayune completed some college.
11.0% of adults in Picayune completed associate's degree.
12.0% of adults in Picayune completed bachelor's degree.
3.0% of adults in Picayune completed master's degree.
1.0% of adults in Picayune completed professional degree.
1.0% of adults in Picayune completed doctorate degree.
| Education | Picayune | MS | USA |
|---|---|---|---|
| < 9th Grade | 5.0% | 4.0% | 4.0% |
| 9-12th Grade | 7.0% | 9.0% | 6.0% |
| High School / GED | 36.0% | 30.0% | 26.0% |
| Some College | 24.0% | 21.0% | 19.0% |
| Associate's Degree | 11.0% | 11.0% | 9.0% |
| Bachelor's Degree | 12.0% | 15.0% | 22.0% |
| Master's Degree | 3.0% | 7.0% | 10.0% |
| Professional Degree | 1.0% | 2.0% | 2.0% |
| Doctorate Degree | 1.0% | 1.0% | 2.0% |
Household Income For Picayune, Mississippi
See the full breakdown
7.6% of households in Picayune earn Less than $10,000.
7.2% of households in Picayune earn $10,000 to $14,999.
12.8% of households in Picayune earn $15,000 to $24,999.
17.1% of households in Picayune earn $25,000 to $34,999.
10.9% of households in Picayune earn $35,000 to $49,999.
15.7% of households in Picayune earn $50,000 to $74,999.
11.3% of households in Picayune earn $75,000 to $99,999.
9.2% of households in Picayune earn $100,000 to $149,999.
5.3% of households in Picayune earn $150,000 to $199,999.
2.9% of households in Picayune earn $200,000 or more.
| Income | Picayune | MS | USA |
|---|---|---|---|
| Less than $10,000 | 7.6% | 7.1% | 5.0% |
| $10,000 to $14,999 | 7.2% | 6.0% | 3.4% |
| $15,000 to $24,999 | 12.8% | 10.0% | 6.3% |
| $25,000 to $34,999 | 17.1% | 9.3% | 6.6% |
| $35,000 to $49,999 | 10.9% | 12.7% | 10.1% |
| $50,000 to $74,999 | 15.7% | 16.5% | 15.5% |
| $75,000 to $99,999 | 11.3% | 12.0% | 12.6% |
| $100,000 to $149,999 | 9.2% | 14.4% | 17.5% |
| $150,000 to $199,999 | 5.3% | 6.2% | 9.6% |
| $200,000 or more | 2.9% | 5.8% | 13.4% |
Source: U.S. Census ACS 5-year estimates (2024)


