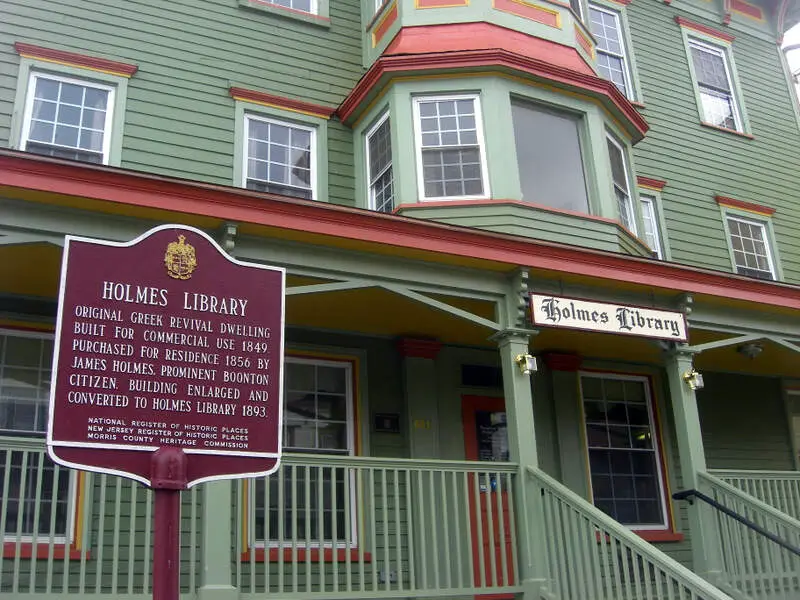

Life in Morris County research summary. HomeSnacks has been researching the quality of life in Morris County over the past eight years using Census data, FBI crime data, cost of living data, and other primary sources. Based on the most recently available data, we found the following about life in Morris County:
The population in Morris County is 508,816.
The median home value in Morris County is $604,106.
The median income in Morris County is $130,808.
The median rent in Morris County is $1,814.
The unemployment rate in Morris County is 5.3%.
The poverty rate in Morris County is 5.0%.
The average high in Morris County is 66.8° and there are 107.3 inches of rainfall annually.
The average high in Morris County is 66.8°.
There are 81.21 nice days each year.
Expect an average of 107.3 inches of rain each year with 12.3 inches of snow.
There is an average of 4:40 hours of sun each day in Morris County.
| Stat | Morris County |
|---|---|
| Mean High | 66.8 |
| Nice Days | 81.21 |
| Rainfall | 107.3 |
| Snowfall | 12.3 |
| Sunny_hours | 4:40 |

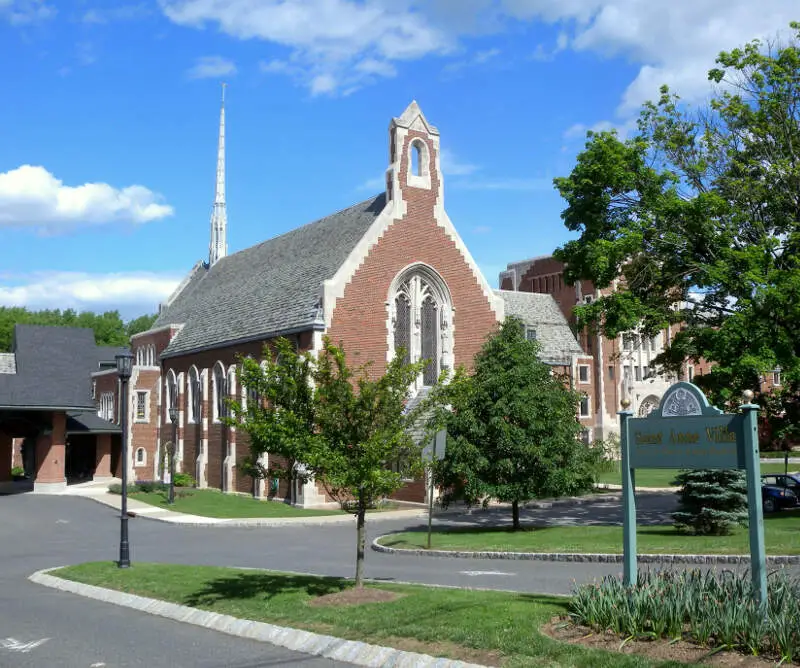

The current population in Morris County is 508,816. The population has increased 3.0% from 2019.
| Year | Population | % Change |
|---|---|---|
| 2022 | 508,347 | 3.2% |
| 2021 | 492,715 | -0.1% |
| 2020 | 493,379 | - |
Morris County is 50.4% female with 256,375 female residents.
Morris County is 49.6% male with 252,441 male residents.
| Gender | Morris County | NJ | USA |
|---|---|---|---|
| Female | 50.4% | 50.7% | 50.4% |
| Male | 49.6% | 49.3% | 49.6% |
Morris County is:
68.6% White with 349,082 White residents.
3.0% African American with 15,442 African American residents.
0.0% American Indian with 197 American Indian residents.
10.7% Asian with 54,415 Asian residents.
0.0% Hawaiian with 22 Hawaiian residents.
0.6% Other with 2,893 Other residents.
2.9% Two Or More with 14,941 Two Or More residents.
14.1% Hispanic with 71,824 Hispanic residents.
| Race | Morris County | NJ | USA |
|---|---|---|---|
| White | 68.6% | 53.0% | 58.9% |
| African American | 3.0% | 12.4% | 12.1% |
| American Indian | 0.0% | 0.1% | 0.6% |
| Asian | 10.7% | 9.8% | 5.7% |
| Hawaiian | 0.0% | 0.0% | 0.2% |
| Other | 0.6% | 0.7% | 0.4% |
| Two Or More | 2.9% | 2.8% | 3.5% |
| Hispanic | 14.1% | 21.2% | 18.7% |
2.7% of households in Morris County earn Less than $10,000.
1.5% of households in Morris County earn $10,000 to $14,999.
2.9% of households in Morris County earn $15,000 to $24,999.
3.9% of households in Morris County earn $25,000 to $34,999.
5.7% of households in Morris County earn $35,000 to $49,999.
10.6% of households in Morris County earn $50,000 to $74,999.
10.8% of households in Morris County earn $75,000 to $99,999.
18.2% of households in Morris County earn $100,000 to $149,999.
13.8% of households in Morris County earn $150,000 to $199,999.
29.8% of households in Morris County earn $200,000 or more.
| Income | Morris County | NJ | USA |
|---|---|---|---|
| Less than $10,000 | 2.7% | 4.1% | 4.9% |
| $10,000 to $14,999 | 1.5% | 3.0% | 3.8% |
| $15,000 to $24,999 | 2.9% | 5.4% | 7.0% |
| $25,000 to $34,999 | 3.9% | 5.7% | 7.4% |
| $35,000 to $49,999 | 5.7% | 8.2% | 10.7% |
| $50,000 to $74,999 | 10.6% | 13.2% | 16.1% |
| $75,000 to $99,999 | 10.8% | 11.6% | 12.8% |
| $100,000 to $149,999 | 18.2% | 18.0% | 17.1% |
| $150,000 to $199,999 | 13.8% | 11.5% | 8.8% |
| $200,000 or more | 29.8% | 19.2% | 11.4% |
2.0% of adults in Morris County completed < 9th grade.
3.0% of adults in Morris County completed 9-12th grade.
19.0% of adults in Morris County completed high school / ged.
13.0% of adults in Morris County completed some college.
6.0% of adults in Morris County completed associate's degree.
33.0% of adults in Morris County completed bachelor's degree.
18.0% of adults in Morris County completed master's degree.
4.0% of adults in Morris County completed professional degree.
2.0% of adults in Morris County completed doctorate degree.
| Education | Morris County | NJ | USA |
|---|---|---|---|
| < 9th Grade | 1% | 3% | 3% |
| 9-12th Grade | 3% | 5% | 6% |
| High School / GED | 19% | 26% | 26% |
| Some College | 13% | 16% | 20% |
| Associate's Degree | 6% | 7% | 9% |
| Bachelor's Degree | 33% | 25% | 21% |
| Master's Degree | 18% | 12% | 10% |
| Professional Degree | 4% | 3% | 2% |
| Doctorate Degree | 2% | 2% | 2% |
HomeSnacks is based in Durham, NC.
We aim to deliver bite-sized pieces of infotainment about where you live.
We use data, analytics, and a sense of humor to determine quality of life for places across the nation.