
Racial diversity in New Jersey is a mixed bag.
There are parts of New Jersey where there’s a high level of diversity. But where will you find the most diverse places in New Jersey?
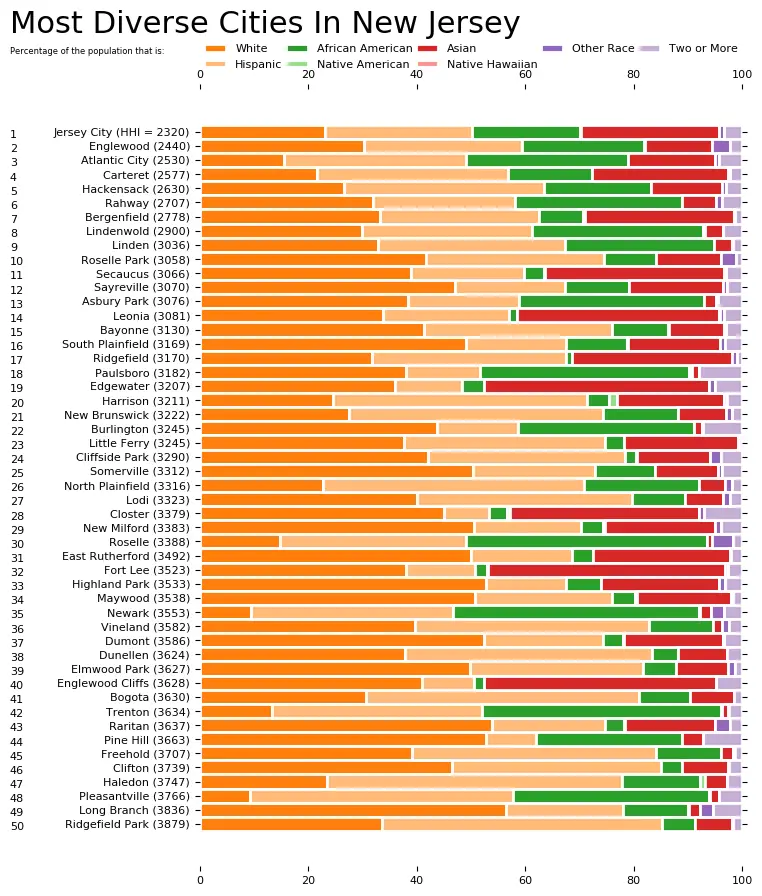
To answer that question, we went to the US Census data. Using Saturday Night Science, we measured the Gini coefficient for all 266 cities in New Jersey to rank them from most to least diverse.
Table Of Contents: Top Ten | Methodology | Summary | Table
Here are the 10 most diverse places in New Jersey for 2026:
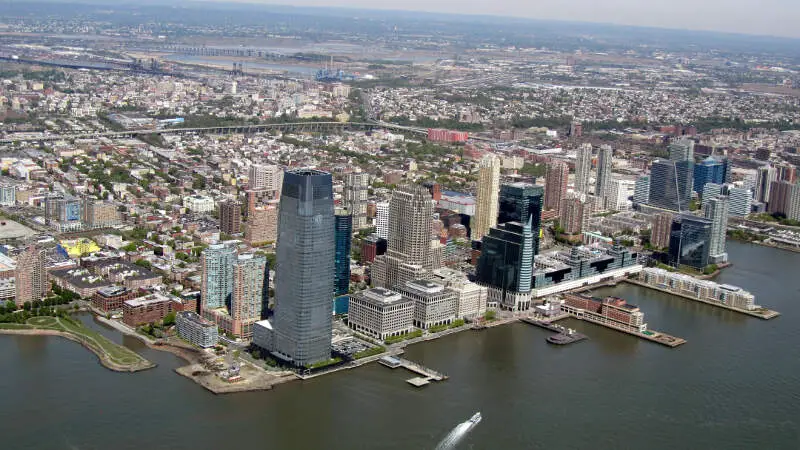
So what city is the most diverse in New Jersey? According to the most Census data, Jersey City took the number one over all spot for diversity in New Jersey.
Read on below to see how we crunched the numbers and how your town ranked. To see where New Jersey ranked as a state, we have a ranking of the most diverse states in Ameria.
For more New Jersey reading:
The 10 Most Diverse Places In New Jersey For 2026

/10
Population: 294,078
HHI: 2,296
% White: 23.5%
% African American: 19.2%
% Hispanic: 25.7%
% Asian: 26.5%
More on Jersey City: Data | Crime | Cost Of Living | Movers

/10
Population: 17,121
HHI: 2,412
% White: 27.9%
% African American: 26.7%
% Hispanic: 25.3%
% Asian: 16.2%
More on Avenel: Data | Cost Of Living | Movers
/10
Population: 6,646
HHI: 2,424
% White: 29.8%
% African American: 23.3%
% Hispanic: 13.9%
% Asian: 28.1%
More on Franklin Center: Data | Cost Of Living | Movers

/10
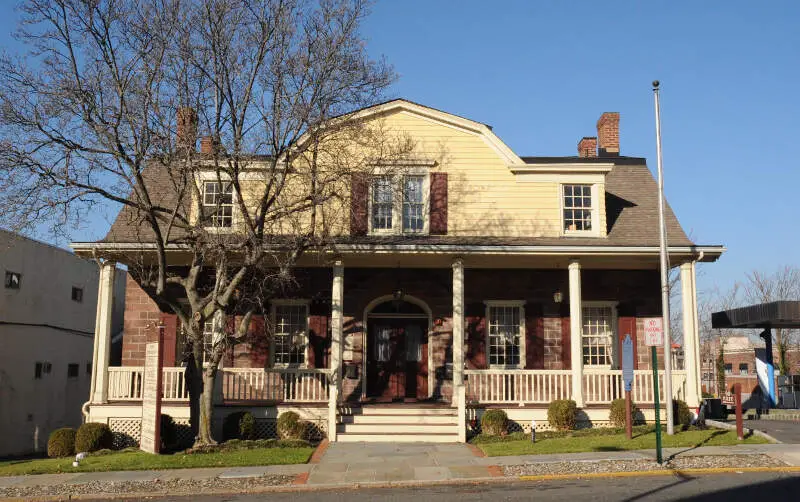
Population: 29,638
HHI: 2,429
% White: 26.1%
% African American: 19.6%
% Hispanic: 33.5%
% Asian: 14.9%
More on Englewood: Data | Crime | Cost Of Living | Movers

/10
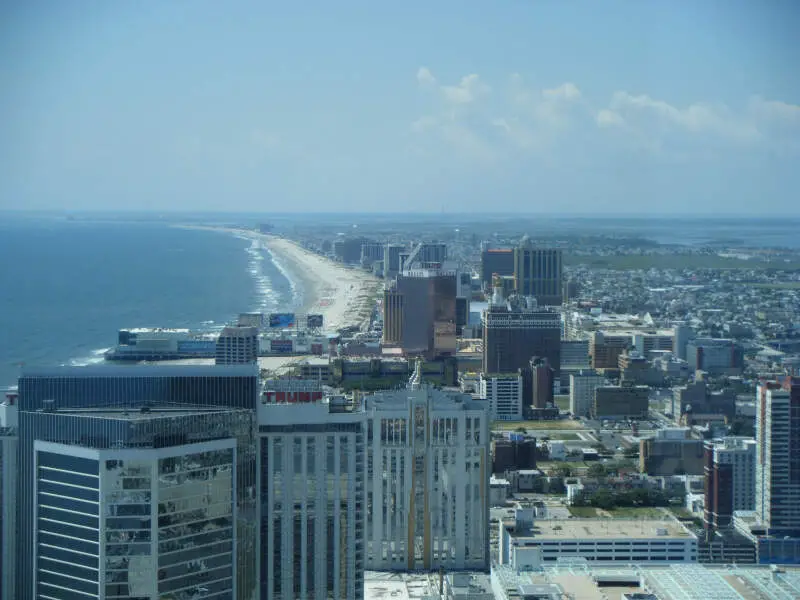
Population: 38,632
HHI: 2,450
% White: 17.6%
% African American: 29.4%
% Hispanic: 31.9%
% Asian: 15.4%
More on Atlantic City: Data | Crime | Cost Of Living | Movers

/10
Population: 9,124
HHI: 2,528
% White: 29.6%
% African American: 30.5%
% Hispanic: 18.4%
% Asian: 19.3%
More on Madison Park: Data | Cost Of Living | Movers

/10
Population: 25,496
HHI: 2,534
% White: 18.7%
% African American: 18.6%
% Hispanic: 34.2%
% Asian: 25.7%
More on Carteret: Data | Crime | Cost Of Living | Movers

/10
Population: 22,720
HHI: 2,544
% White: 32.7%
% African American: 28.1%
% Hispanic: 11.6%
% Asian: 23.1%
More on Somerset: Data | Cost Of Living | Movers

/10
Population: 46,057
HHI: 2,593
% White: 26.0%
% African American: 18.1%
% Hispanic: 37.2%
% Asian: 13.8%
More on Hackensack: Data | Crime | Cost Of Living | Movers

/10
Population: 30,109
HHI: 2,621
% White: 29.3%
% African American: 30.8%
% Hispanic: 27.4%
% Asian: 5.7%
More on Rahway: Data | Crime | Cost Of Living | Movers
Methodology: How we determined the most diverse cities in New Jersey for 2026
We still believe in the accuracy of data — especially from the Census — and Saturday Night Science. So that’s where we went to get the race breakdown across New Jersey.
That leads us to the Census’s most recently available data, the 2020-2024 American Community Survey data from the US Census.
Specifically, we looked at table B03002: HISPANIC OR LATINO ORIGIN BY RACE. Here are the category names as defined by the Census:
- White alone*
- Black or African American alone*
- American Indian and Alaska Native alone*
- Asian alone*
- Native Hawaiian and Other Pacific Islander alone*
- Some other race alone*
- Two or more races*
- Hispanic or Latino
We limited our analysis to non-CDPs with a population greater than 5,000 people. That left us with 266 cities.
We then calculated the HHI for each city by finding the racial breakdown of a city in percent terms, squaring them, and then adding the squares together. This left us with scores ranging from 2,296 (Jersey City) to 9,241 (Little Silver).
Finally, we ranked each city based on the HHI, with a lower score being more diverse than a high score. Jersey City took the distinction of being the most diverse, while Little Silver was the least diverse city.
We updated this article for 2026. This report is our eleventh time ranking the most diverse places in New Jersey.
Summary: Diversity Across New Jersey
If you’re looking for a scientific breakdown of diversity across New Jersey, this is an accurate list.
The most diverse cities in New Jersey are Jersey City, Avenel, Franklin Center, Englewood, Atlantic City, Madison Park, Carteret, Somerset, Hackensack, and Rahway.
If you’re curious enough, here are the least diverse places in New Jersey:
- Little Silver
- Beach Haven West
- Fair Haven
For more New Jersey reading, check out:
- Best Places To Live In New Jersey
- Cheapest Places To Live In New Jersey
- Most Dangerous Cities In New Jersey
- Best Places To Raise A Family In New Jersey
- Safest Places In New Jersey
- Worst Places To Live In New Jersey
Race By City In New Jersey For 2026
| Rank | City | Population | HHI | % White | % Black | % Hispanic | % Asian |
|---|---|---|---|---|---|---|---|
| 1 | Jersey City, NJ | 294,078 | 2,296 | 23.5% | 19.2% | 25.7% | 26.5% |
| 2 | Avenel, NJ | 17,121 | 2,412 | 27.9% | 26.7% | 25.3% | 16.2% |
| 3 | Franklin Center, NJ | 6,646 | 2,424 | 29.8% | 23.3% | 13.9% | 28.1% |
| 4 | Englewood, NJ | 29,638 | 2,429 | 26.1% | 19.6% | 33.5% | 14.9% |
| 5 | Atlantic City, NJ | 38,632 | 2,450 | 17.6% | 29.4% | 31.9% | 15.4% |
| 6 | Madison Park, NJ | 9,124 | 2,528 | 29.6% | 30.5% | 18.4% | 19.3% |
| 7 | Carteret, NJ | 25,496 | 2,534 | 18.7% | 18.6% | 34.2% | 25.7% |
| 8 | Somerset, NJ | 22,720 | 2,544 | 32.7% | 28.1% | 11.6% | 23.1% |
| 9 | Hackensack, NJ | 46,057 | 2,593 | 26.0% | 18.1% | 37.2% | 13.8% |
| 10 | Rahway, NJ | 30,109 | 2,621 | 29.3% | 30.8% | 27.4% | 5.7% |
| 11 | Pomona, NJ | 7,995 | 2,664 | 39.6% | 10.4% | 15.3% | 26.1% |
| 12 | Franklin Park, NJ | 13,211 | 2,687 | 17.0% | 23.8% | 13.8% | 40.3% |
| 13 | Woodbridge, NJ | 20,756 | 2,777 | 38.0% | 9.4% | 24.6% | 25.2% |
| 14 | Lindenwold, NJ | 21,719 | 2,788 | 27.5% | 33.1% | 29.8% | 3.3% |
| 15 | Fords, NJ | 12,771 | 2,816 | 42.0% | 13.5% | 24.0% | 16.8% |
| 16 | Bergenfield, NJ | 28,450 | 2,822 | 32.7% | 6.9% | 33.0% | 24.7% |
| 17 | Secaucus, NJ | 21,778 | 2,833 | 33.7% | 5.3% | 18.3% | 36.1% |
| 18 | Harrison, NJ | 20,369 | 2,841 | 27.2% | 3.7% | 39.7% | 22.0% |
| 19 | Finderne, NJ | 6,489 | 2,850 | 38.5% | 7.8% | 30.7% | 18.6% |
| 20 | Paulsboro, NJ | 6,248 | 2,853 | 37.0% | 31.9% | 19.8% | 2.8% |
| 21 | Kingston Estates, NJ | 6,668 | 2,859 | 43.8% | 2.6% | 21.4% | 19.8% |
| 22 | Linden, NJ | 44,192 | 2,900 | 30.1% | 27.0% | 35.2% | 3.9% |
| 23 | Roselle Park, NJ | 14,093 | 2,954 | 40.3% | 9.6% | 32.2% | 14.0% |
| 24 | Leonia, NJ | 9,336 | 2,979 | 30.4% | 2.8% | 25.3% | 37.4% |
| 25 | Ridgefield, NJ | 11,498 | 2,990 | 32.5% | 1.8% | 37.8% | 22.0% |
| 26 | Asbury Park, NJ | 15,295 | 3,003 | 38.1% | 29.7% | 25.5% | 2.2% |
| 27 | Sayreville, NJ | 45,838 | 3,048 | 46.9% | 11.5% | 21.2% | 16.1% |
| 28 | Fort Dix, NJ | 7,984 | 3,068 | 38.9% | 27.0% | 28.5% | 2.4% |
| 29 | Bayonne, NJ | 71,553 | 3,074 | 42.5% | 12.0% | 32.1% | 9.1% |
| 30 | South Plainfield, NJ | 24,473 | 3,143 | 47.9% | 9.7% | 17.0% | 21.3% |
| 31 | Cliffside Park, NJ | 25,781 | 3,144 | 41.4% | 2.7% | 34.5% | 14.4% |
| 32 | Edgewater, NJ | 14,759 | 3,160 | 36.9% | 3.5% | 16.6% | 38.7% |
| 33 | Burlington, NJ | 9,993 | 3,185 | 40.0% | 36.7% | 11.6% | 1.2% |
| 34 | Raritan, NJ | 8,368 | 3,192 | 47.0% | 4.0% | 21.7% | 21.7% |
| 35 | Haledon, NJ | 8,980 | 3,201 | 26.3% | 17.8% | 46.4% | 3.5% |
| 36 | Iselin, NJ | 19,551 | 3,207 | 23.1% | 10.8% | 14.8% | 48.3% |
| 37 | Little Ferry, NJ | 10,996 | 3,227 | 37.2% | 3.1% | 37.6% | 20.5% |
| 38 | Woodbury, NJ | 10,042 | 3,239 | 48.5% | 21.2% | 19.1% | 1.3% |
| 39 | New Milford, NJ | 16,995 | 3,265 | 48.9% | 5.0% | 20.5% | 20.3% |
| 40 | Brookdale, NJ | 9,960 | 3,280 | 50.4% | 7.7% | 22.3% | 11.9% |
| 41 | Twin Rivers, NJ | 8,382 | 3,352 | 44.2% | 7.5% | 35.6% | 6.9% |
| 42 | Pine Hill, NJ | 10,802 | 3,357 | 48.1% | 25.9% | 18.4% | 2.2% |
| 43 | Wood-Ridge, NJ | 10,218 | 3,364 | 49.0% | 6.8% | 20.9% | 21.9% |
| 44 | Long Branch, NJ | 32,530 | 3,394 | 50.8% | 10.7% | 25.2% | 2.7% |
| 45 | Somerville, NJ | 13,410 | 3,396 | 51.8% | 11.3% | 21.1% | 10.8% |
| 46 | Maywood, NJ | 10,093 | 3,410 | 48.4% | 4.6% | 27.3% | 17.1% |
| 47 | Dumont, NJ | 18,279 | 3,411 | 48.3% | 2.9% | 27.0% | 18.3% |
| 48 | Elmwood Park, NJ | 21,412 | 3,425 | 48.6% | 10.4% | 29.5% | 9.3% |
| 49 | Lodi, NJ | 26,082 | 3,447 | 42.7% | 7.3% | 39.0% | 6.7% |
| 50 | Fort Lee, NJ | 40,067 | 3,480 | 37.2% | 2.3% | 13.5% | 43.6% |
| 51 | Vineland, NJ | 61,006 | 3,510 | 37.0% | 10.9% | 44.8% | 2.1% |
| 52 | Closter, NJ | 8,606 | 3,515 | 48.8% | 2.0% | 11.1% | 31.0% |
| 53 | Kendall Park, NJ | 10,011 | 3,521 | 46.3% | 3.5% | 9.9% | 35.3% |
| 54 | Newark, NJ | 310,178 | 3,523 | 8.9% | 44.8% | 37.6% | 2.0% |
| 55 | Bogota, NJ | 9,360 | 3,524 | 30.7% | 9.2% | 49.0% | 9.9% |
| 56 | East Rutherford, NJ | 10,313 | 3,529 | 51.7% | 5.6% | 22.7% | 17.5% |
| 57 | Somerdale, NJ | 5,581 | 3,533 | 48.5% | 31.9% | 11.0% | 3.9% |
| 58 | River Edge, NJ | 12,091 | 3,581 | 50.3% | 4.7% | 11.4% | 29.8% |
| 59 | South River, NJ | 16,124 | 3,599 | 52.8% | 13.5% | 24.5% | 4.0% |
| 60 | Morganville, NJ | 5,902 | 3,647 | 54.4% | 1.1% | 10.9% | 22.6% |
| 61 | Ridgefield Park, NJ | 13,235 | 3,660 | 32.1% | 8.9% | 50.0% | 6.8% |
| 62 | Roselle, NJ | 22,646 | 3,665 | 11.3% | 39.7% | 44.2% | 1.4% |
| 63 | Dayton, NJ | 7,952 | 3,671 | 31.4% | 6.0% | 6.6% | 50.9% |
| 64 | Kearny, NJ | 40,614 | 3,696 | 30.7% | 4.7% | 51.7% | 4.3% |
| 65 | Dunellen, NJ | 7,911 | 3,699 | 39.7% | 4.9% | 45.2% | 6.1% |
| 66 | Mays Landing, NJ | 6,406 | 3,704 | 56.4% | 15.1% | 13.0% | 4.1% |
| 67 | New Brunswick, NJ | 56,345 | 3,704 | 22.8% | 11.6% | 54.6% | 7.9% |
| 68 | Clifton, NJ | 89,379 | 3,745 | 45.9% | 3.5% | 39.4% | 8.3% |
| 69 | Highland Park, NJ | 15,121 | 3,751 | 55.1% | 3.6% | 15.8% | 21.1% |
| 70 | Middlesex, NJ | 14,645 | 3,756 | 54.2% | 5.2% | 24.3% | 13.8% |
| 71 | North Plainfield, NJ | 22,809 | 3,756 | 15.8% | 22.1% | 54.7% | 4.1% |
| 72 | Colonia, NJ | 18,587 | 3,772 | 56.4% | 5.1% | 17.5% | 15.6% |
| 73 | Paramus, NJ | 26,568 | 3,773 | 54.1% | 4.1% | 13.0% | 25.7% |
| 74 | Morristown, NJ | 20,453 | 3,783 | 51.1% | 7.4% | 32.9% | 4.2% |
| 75 | Bradley Gardens, NJ | 14,165 | 3,798 | 47.4% | 1.3% | 8.6% | 38.3% |
| 76 | North Arlington, NJ | 16,461 | 3,804 | 52.7% | 4.0% | 30.3% | 8.7% |
| 77 | Florence, NJ | 5,242 | 3,827 | 57.8% | 15.0% | 12.5% | 5.5% |
| 78 | Millville, NJ | 27,511 | 3,835 | 55.8% | 17.4% | 19.6% | 0.7% |
| 79 | Palisades Park, NJ | 20,290 | 3,846 | 19.2% | 2.6% | 22.3% | 54.5% |
| 80 | Blackwells Mills, NJ | 10,301 | 3,866 | 53.8% | 4.4% | 5.5% | 29.7% |
| 81 | Trenton, NJ | 90,338 | 3,870 | 10.6% | 40.0% | 46.4% | 0.4% |
| 82 | Caldwell, NJ | 9,003 | 3,900 | 56.9% | 4.7% | 20.8% | 13.9% |
| 83 | Pleasantville, NJ | 20,712 | 3,905 | 8.2% | 30.4% | 53.7% | 2.0% |
| 84 | Echelon, NJ | 13,284 | 3,911 | 56.1% | 9.1% | 4.4% | 25.5% |
| 85 | Tenafly, NJ | 15,319 | 3,943 | 50.6% | 1.2% | 8.4% | 36.0% |
| 86 | Metuchen, NJ | 15,144 | 3,949 | 58.7% | 4.7% | 8.4% | 17.9% |
| 87 | East Franklin, NJ | 11,070 | 3,961 | 7.2% | 31.7% | 53.7% | 3.7% |
| 88 | Westwood, NJ | 11,283 | 3,964 | 56.4% | 3.5% | 26.2% | 7.5% |
| 89 | Budd Lake, NJ | 10,650 | 3,968 | 58.0% | 9.2% | 21.2% | 7.4% |
| 90 | Jamesburg, NJ | 5,770 | 3,982 | 41.0% | 2.3% | 47.1% | 8.7% |
| 91 | Eato, NJ | 13,575 | 3,993 | 59.4% | 10.5% | 11.3% | 14.5% |
| 92 | Totowa, NJ | 10,959 | 3,998 | 56.9% | 5.3% | 25.7% | 7.4% |
| 93 | Carneys Point, NJ | 8,050 | 4,022 | 58.1% | 19.6% | 15.3% | 2.8% |
| 94 | Garfield, NJ | 32,783 | 4,025 | 41.8% | 5.3% | 47.3% | 3.7% |
| 95 | Country Lake Estates, NJ | 5,055 | 4,042 | 59.2% | 18.6% | 9.1% | 1.7% |
| 96 | Englewood Cliffs, NJ | 5,362 | 4,064 | 42.2% | 1.2% | 5.4% | 47.3% |
| 97 | Hight, NJ | 5,920 | 4,114 | 58.5% | 7.1% | 24.3% | 6.5% |
| 98 | Old Tappan, NJ | 6,008 | 4,122 | 49.0% | 3.2% | 4.5% | 41.1% |
| 99 | Freehold, NJ | 12,507 | 4,126 | 35.2% | 5.7% | 53.3% | 3.4% |
| 100 | Woodland Park, NJ | 13,355 | 4,128 | 55.4% | 3.2% | 31.5% | 6.3% |