
Before you decide to relocate to New Jersey, it’s important to research the exact cost of living around the state. And that’s what we’re going to help you do.
These are the places in New Jersey that cost a pretty penny — the most expensive cities in the state.
We used Saturday Night Science to compare the 2020-2024 American Community Survey on cost of living for the 262 places in New Jersey with more than 5,000 people.
After we saved up for months and could finally afford it, we landed on this list of the ten most expensive cities in New Jersey for 2026.
Table Of Contents: Top Ten | Methodology | Summary | Table
The 10 Most Expensive Places To Live In New Jersey For 2026
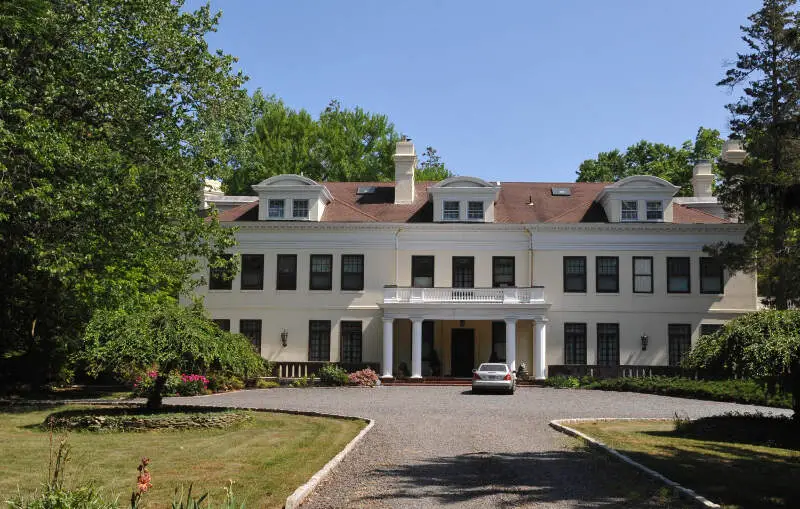
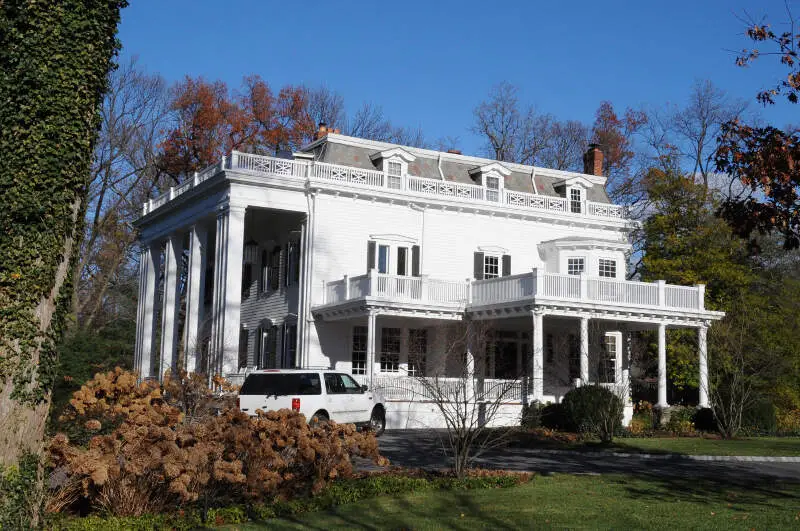
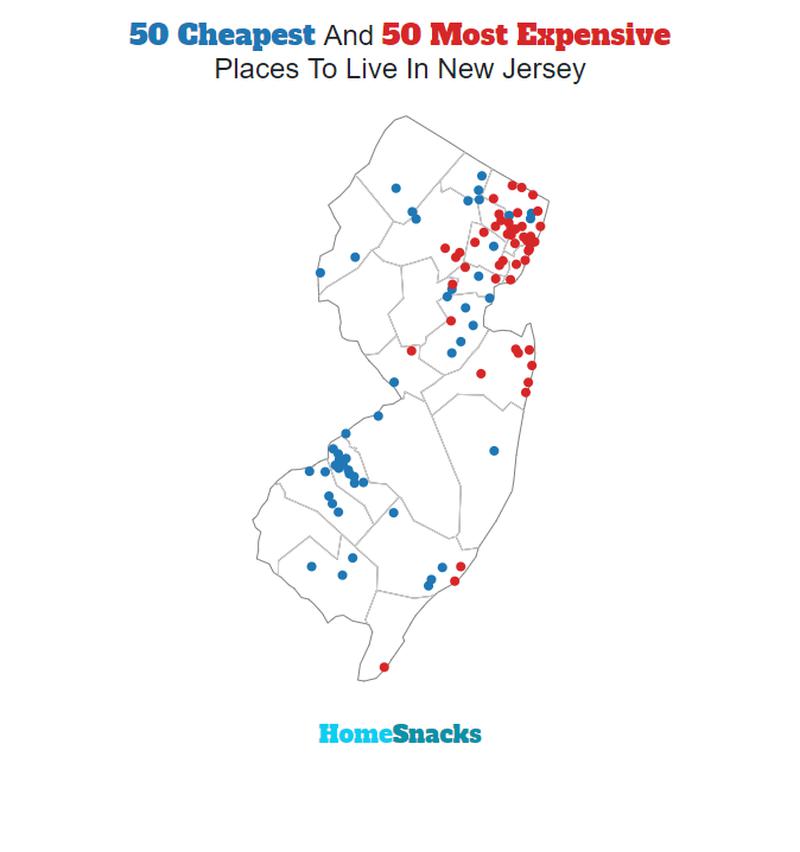
What’s the most expensive place to live in New Jersey? Well, HomeSnacks crunched the numbers and discovered that Short Hills is the most expensive place to live in New Jersey.
Salem (the cheapest place to live in New Jersey) can show these guys how to live on a budget in the coming years. Read on for how these places had costs rise faster than inflation.
And if you already knew these places were expensive, check out some more reading about New Jersey and the most expensive cities in the country:
The 10 Most Expensive Places To Live In New Jersey For 2026

/10
Population: 14,923
Cost Of Living Index: 263
Median Income: $250,001
Average Home Price: $2,309,383
Home Price To Income Ratio: 9.2x
More on Short Hills: Data | Cost Of Living | Movers
The overall cost of living in Short Hills is 263. The median income in Short Hills comes in at $250,001 and the average home value is $2,309,383 for 2026.

/10
Population: 7,241
Cost Of Living Index: 238
Median Income: $250,001
Average Home Price: $2,183,827
Home Price To Income Ratio: 8.7x
More on Rumson: Data | Crime | Cost Of Living | Movers
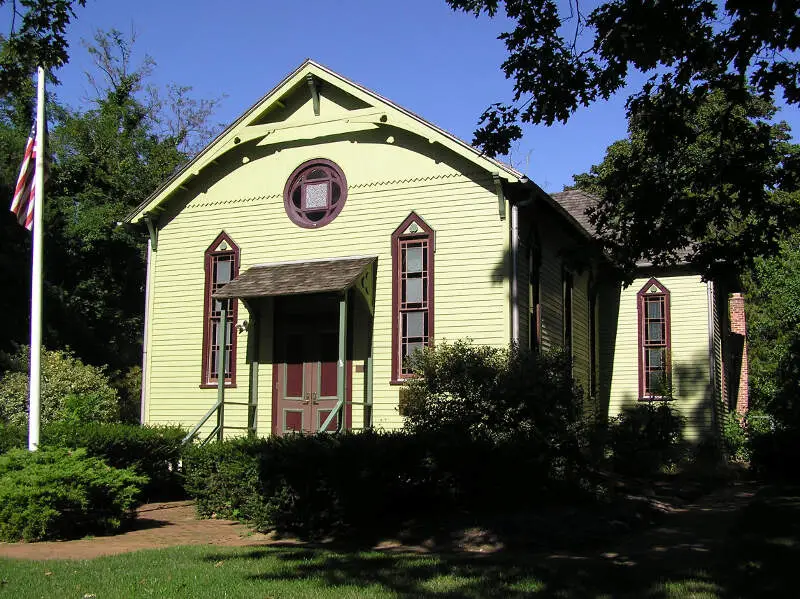
The overall cost of living in Rumson is 238. The median income in Rumson comes in at $250,001 and the average home value is $2,183,827 for 2026.

/10
Population: 5,362
Cost Of Living Index: 235
Median Income: $230,611
Average Home Price: $1,733,277
Home Price To Income Ratio: 7.5x
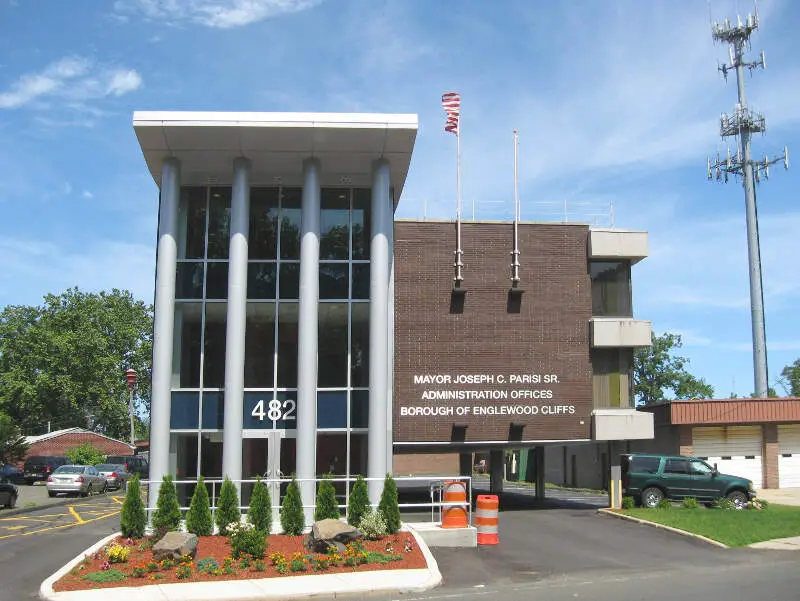
More on Englewood Cliffs: Data | Crime | Cost Of Living | Movers
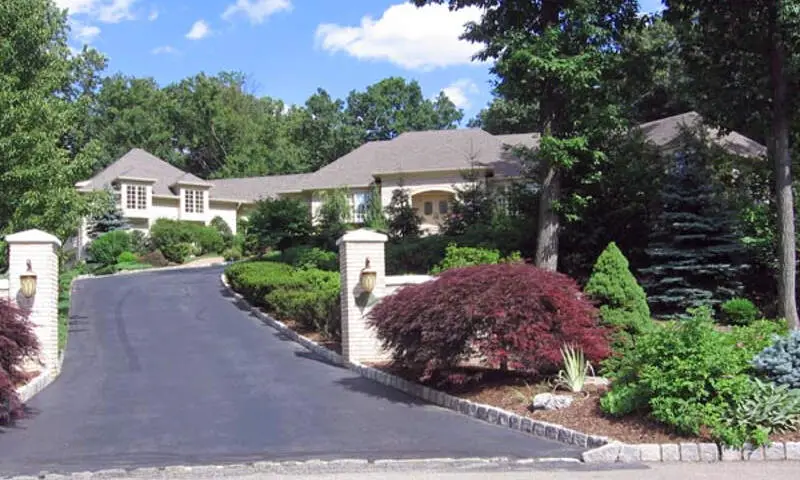
The overall cost of living in Englewood Cliffs is 235. The median income in Englewood Cliffs comes in at $230,611 and the average home value is $1,733,277 for 2026.

/10
Population: 11,084
Cost Of Living Index: 221
Median Income: $235,795
Average Home Price: $1,557,852
Home Price To Income Ratio: 6.6x
More on Franklin Lakes: Data | Crime | Cost Of Living | Movers
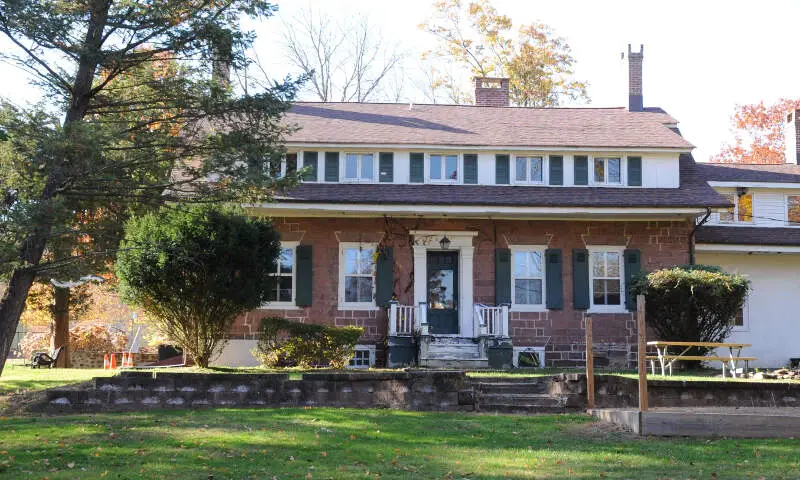
The overall cost of living in Franklin Lakes is 221. The median income in Franklin Lakes comes in at $235,795 and the average home value is $1,557,852 for 2026.

/10
Population: 8,439
Cost Of Living Index: 213
Median Income: $250,001
Average Home Price: $1,412,975
Home Price To Income Ratio: 5.7x
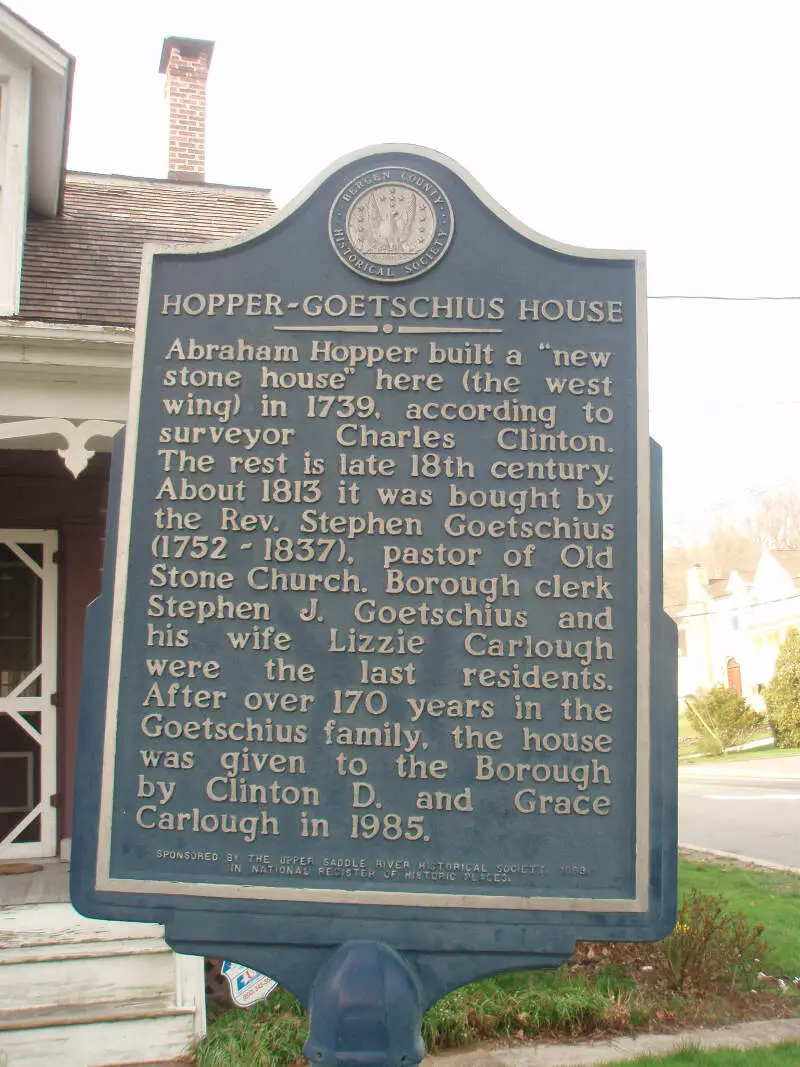
More on Upper Saddle River: Data | Crime | Cost Of Living | Movers
The overall cost of living in Upper Saddle River is 213. The median income in Upper Saddle River comes in at $250,001 and the average home value is $1,412,975 for 2026.

/10
Population: 15,319
Cost Of Living Index: 204
Median Income: $208,200
Average Home Price: $1,262,422
Home Price To Income Ratio: 6.1x
More on Tenafly: Data | Crime | Cost Of Living | Movers
The overall cost of living in Tenafly is 204. The median income in Tenafly comes in at $208,200 and the average home value is $1,262,422 for 2026.

/10
Population: 6,170
Cost Of Living Index: 201
Median Income: $250,001
Average Home Price: $1,483,126
Home Price To Income Ratio: 5.9x
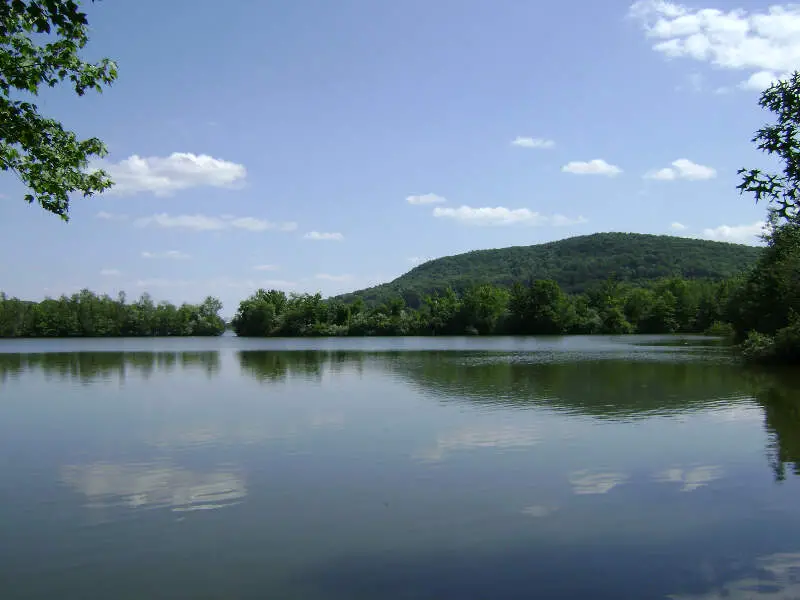
More on Fair Haven: Data | Crime | Cost Of Living | Movers
The overall cost of living in Fair Haven is 201. The median income in Fair Haven comes in at $250,001 and the average home value is $1,483,126 for 2026.

/10
Population: 6,656
Cost Of Living Index: 200
Median Income: $208,245
Average Home Price: $1,133,695
Home Price To Income Ratio: 5.4x
More on North Caldwell: Data | Crime | Cost Of Living | Movers
The overall cost of living in North Caldwell is 200. The median income in North Caldwell comes in at $208,245 and the average home value is $1,133,695 for 2026.

/10
Population: 6,152
Cost Of Living Index: 196
Median Income: $213,981
Average Home Price: $1,228,602
Home Price To Income Ratio: 5.7x
More on Woodcliff Lake: Data | Crime | Cost Of Living | Movers
The overall cost of living in Woodcliff Lake is 196. The median income in Woodcliff Lake comes in at $213,981 and the average home value is $1,228,602 for 2026.

/10
Population: 6,105
Cost Of Living Index: 195
Median Income: $240,853
Average Home Price: $1,110,499
Home Price To Income Ratio: 4.6x
More on Little Silver: Data | Crime | Cost Of Living | Movers
The overall cost of living in Little Silver is 195. The median income in Little Silver comes in at $240,853 and the average home value is $1,110,499 for 2026.
Methodology: How We Determined The Most Expensive Places To Live In The Garden State For 2026
The two most important things to think about when it comes to being able to afford a city in New Jersey are:
- How much money do I make?
- How much do I have to spend to live there?
You need to understand your costs in the context of how much money you make.
For example, if the median household earns $100,000 and spends $40,000 on housing, it’s actually cheaper to live there than a place with a median income of $50,000 and housing costs of $21,000. You might spend more on housing, but you have more money overall to play with.
With that example in mind, we derived several statistics from the latest Census American Community Survey 2020-2024 around incomes and costs. They are:
- Overall Cost Of Living Index
- Median Home Price / Median Income (lower is better)
- Median Income / Median Rent (Higher is better)
- Median Home Price
You can then compare these metrics in each of the places in New Jersey to figure out which is the most expensive.
You are left with a “Cost of Living Index” by taking the average rank of each of these metrics for each city.
So we used that cost of living index to rank all of the 262 places in New Jersey that have more than 5,000 people.
The place with the highest cost of living in New Jersey according to the data is Short Hills. We updated this article for 2026. This article is our eleventh time ranking the most expensive places to live in New Jersey.
Summary: Taking A Chunk Out Of Your Paycheck In New Jersey For 2026
Well, there you have it, the places in New Jersey that have the highest cost of living, with Short Hills ranking as the most expensive city in the Garden State.
The most expensive cities in New Jersey are Short Hills, Rumson, Englewood Cliffs, Franklin Lakes, Upper Saddle River, Tenafly, Fair Haven, North Caldwell, Woodcliff Lake, and Little Silver.
Here’s a look at the most affordable cities in New Jersey according to the data:
- Salem
- Paulsboro
- Pennsville
For more New Jersey reading, check out:
- Best Places To Live In New Jersey
- Cheapest Places To Live In New Jersey
- Most Dangerous Cities In New Jersey
- Best Places To Raise A Family In New Jersey
- Safest Places In New Jersey
- Worst Places To Live In New Jersey
Most Expensive Cities In New Jersey
| Rank | City | Cost Of Living | Population | Median Income | Average Home Price | Home/Income Ratio |
|---|---|---|---|---|---|---|
| 1 | Short Hills | 263 | 14,923 | $250,001 | $2,309,383 | 9.2x |
| 2 | Rumson | 238 | 7,241 | $250,001 | $2,183,827 | 8.7x |
| 3 | Englewood Cliffs | 235 | 5,362 | $230,611 | $1,733,277 | 7.5x |
| 4 | Franklin Lakes | 221 | 11,084 | $235,795 | $1,557,852 | 6.6x |
| 5 | Upper Saddle River | 213 | 8,439 | $250,001 | $1,412,975 | 5.7x |
| 6 | Tenafly | 204 | 15,319 | $208,200 | $1,262,422 | 6.1x |
| 7 | Fair Haven | 201 | 6,170 | $250,001 | $1,483,126 | 5.9x |
| 8 | North Caldwell | 200 | 6,656 | $208,245 | $1,133,695 | 5.4x |
| 9 | Woodcliff Lake | 196 | 6,152 | $213,981 | $1,228,602 | 5.7x |
| 10 | Little Silver | 195 | 6,105 | $240,853 | $1,110,499 | 4.6x |
| 11 | Hoboken | 191 | 58,668 | $180,579 | $855,399 | 4.7x |
| 12 | Summit | 190 | 22,705 | $190,304 | $1,372,010 | 7.2x |
| 13 | Chatham | 190 | 9,407 | $241,500 | $1,310,369 | 5.4x |
| 14 | Old Tappan | 189 | 6,008 | $205,385 | $1,224,145 | 6.0x |
| 15 | Upper Montclair | 184 | 12,457 | $250,001 | $1,239,321 | 5.0x |
| 16 | Mountainside | 183 | 7,049 | $211,538 | $1,043,568 | 4.9x |
| 17 | Westfield | 182 | 31,111 | $232,629 | $1,269,852 | 5.5x |
| 18 | Ridgewood | 182 | 26,308 | $208,211 | $1,200,488 | 5.8x |
| 19 | Watchung | 182 | 6,485 | $173,672 | $1,060,984 | 6.1x |
| 20 | Cresskill | 181 | 9,174 | $170,376 | $1,000,898 | 5.9x |
| 21 | Blackwells Mills | 179 | 10,301 | $250,001 | $921,032 | 3.7x |
| 22 | Madison | 178 | 16,447 | $171,471 | $990,722 | 5.8x |
| 23 | Closter | 176 | 8,606 | $190,469 | $1,153,805 | 6.1x |
| 24 | Paramus | 175 | 26,568 | $144,349 | $1,039,756 | 7.2x |
| 25 | Edgewater | 174 | 14,759 | $124,050 | $714,157 | 5.8x |
| 26 | Florham Park | 174 | 13,564 | $158,696 | $1,025,255 | 6.5x |
| 27 | Glen Rock | 174 | 12,154 | $215,096 | $1,056,914 | 4.9x |
| 28 | Allendale | 174 | 6,865 | $160,162 | $1,073,640 | 6.7x |
| 29 | Bernardsville | 173 | 7,916 | $236,115 | $1,003,866 | 4.3x |
| 30 | Manasquan | 173 | 5,922 | $142,944 | $1,158,873 | 8.1x |
| 31 | Norwood | 172 | 5,724 | $178,311 | $898,893 | 5.0x |
| 32 | Glen Ridge | 171 | 7,943 | $250,001 | $1,125,696 | 4.5x |
| 33 | Kinnelon | 170 | 10,013 | $187,438 | $836,758 | 4.5x |
| 34 | Oradell | 170 | 8,235 | $221,322 | $975,411 | 4.4x |
| 35 | Oceanport | 168 | 6,195 | $126,094 | $910,435 | 7.2x |
| 36 | New Providence | 167 | 13,727 | $161,599 | $990,084 | 6.1x |
| 37 | Martinsville | 166 | 11,559 | $205,000 | $902,737 | 4.4x |
| 38 | Montvale | 164 | 8,901 | $178,269 | $920,950 | 5.2x |
| 39 | Morris Plains | 164 | 6,315 | $154,923 | $727,185 | 4.7x |
| 40 | Ramsey | 163 | 14,805 | $160,996 | $863,403 | 5.4x |
| 41 | Park Ridge | 163 | 9,406 | $171,029 | $845,037 | 4.9x |
| 42 | Belle Mead | 163 | 6,394 | $223,250 | $1,015,391 | 4.5x |
| 43 | Roseland | 163 | 6,268 | $164,458 | $819,879 | 5.0x |
| 44 | Belmar | 162 | 5,869 | $93,573 | $1,009,846 | 10.8x |
| 45 | Palisades Park | 160 | 20,290 | $94,743 | $987,742 | 10.4x |
| 46 | Robertsville | 157 | 12,035 | $210,661 | $858,502 | 4.1x |
| 47 | Emerson | 156 | 7,305 | $155,536 | $780,189 | 5.0x |
| 48 | Ocean City | 155 | 11,261 | $101,782 | $1,099,876 | 10.8x |
| 49 | Hillsdale | 155 | 10,144 | $186,688 | $843,787 | 4.5x |
| 50 | Morganville | 155 | 5,902 | $161,500 | $851,869 | 5.3x |
| 51 | East Freehold | 155 | 5,096 | $189,219 | $809,380 | 4.3x |
| 52 | Secaucus | 154 | 21,778 | $139,821 | $662,669 | 4.7x |
| 53 | Princeton Meadows | 154 | 15,561 | $131,213 | $834,192 | 6.4x |
| 54 | Fanwood | 154 | 7,799 | $195,529 | $791,728 | 4.0x |
| 55 | Bradley Gardens | 152 | 14,165 | $177,849 | $684,571 | 3.8x |
| 56 | River Edge | 152 | 12,091 | $159,028 | $839,655 | 5.3x |
| 57 | North Haledon | 152 | 8,778 | $125,313 | $712,134 | 5.7x |
| 58 | Lakewood | 151 | 69,585 | $56,968 | $576,895 | 10.1x |
| 59 | Fairview | 151 | 15,099 | $63,606 | $654,535 | 10.3x |
| 60 | Leonia | 151 | 9,336 | $129,665 | $808,460 | 6.2x |
| 61 | Midland Park | 151 | 7,019 | $146,841 | $732,464 | 5.0x |
| 62 | Lincroft | 151 | 6,939 | $189,000 | $1,007,765 | 5.3x |
| 63 | Franklin Center | 151 | 6,646 | $157,212 | $766,900 | 4.9x |
| 64 | Haddonfield | 150 | 12,595 | $200,400 | $830,376 | 4.1x |
| 65 | Margate City | 150 | 5,234 | $121,800 | $1,097,066 | 9.0x |
| 66 | Morristown | 149 | 20,453 | $121,340 | $887,261 | 7.3x |
| 67 | Metuchen | 149 | 15,144 | $158,052 | $683,090 | 4.3x |
| 68 | Oakland | 149 | 12,768 | $162,019 | $750,020 | 4.6x |
| 69 | Ridgefield | 149 | 11,498 | $118,059 | $778,379 | 6.6x |
| 70 | Rutherford | 147 | 18,894 | $143,153 | $738,683 | 5.2x |
| 71 | Westwood | 147 | 11,283 | $165,781 | $755,182 | 4.6x |
| 72 | Jersey City | 146 | 294,078 | $97,710 | $658,269 | 6.7x |
| 73 | Monmouth Junction | 146 | 9,141 | $133,585 | $690,687 | 5.2x |
| 74 | Heathcote | 146 | 7,717 | $141,295 | $711,137 | 5.0x |
| 75 | Fair Lawn | 145 | 35,610 | $144,574 | $709,175 | 4.9x |
| 76 | Cliffside Park | 145 | 25,781 | $93,452 | $645,670 | 6.9x |
| 77 | Waldwick | 145 | 10,164 | $177,962 | $738,299 | 4.1x |
| 78 | Caldwell | 145 | 9,003 | $96,824 | $724,634 | 7.5x |
| 79 | Green Knoll | 145 | 6,789 | $165,227 | $748,229 | 4.5x |
| 80 | West Long Branch | 144 | 8,586 | $114,271 | $959,619 | 8.4x |
| 81 | Wood-Ridge | 142 | 10,218 | $136,108 | $709,508 | 5.2x |
| 82 | Yorketown | 142 | 7,261 | $173,510 | $749,357 | 4.3x |
| 83 | Ramtown | 142 | 6,203 | $145,663 | $610,888 | 4.2x |
| 84 | Beach Haven West | 142 | 5,120 | $119,394 | $804,117 | 6.7x |
| 85 | Succasunna | 141 | 9,799 | $161,712 | $650,100 | 4.0x |
| 86 | Dayton | 141 | 7,952 | $151,902 | $654,995 | 4.3x |
| 87 | Carlstadt | 141 | 6,378 | $115,444 | $656,613 | 5.7x |
| 88 | Hawthorne | 140 | 19,628 | $110,237 | $629,473 | 5.7x |
| 89 | New Milford | 140 | 16,995 | $114,889 | $727,506 | 6.3x |
| 90 | West Freehold | 140 | 14,883 | $130,800 | $662,892 | 5.1x |
| 91 | Hasbrouck Heights | 140 | 12,115 | $123,734 | $709,659 | 5.7x |
| 92 | Kendall Park | 140 | 10,011 | $165,958 | $728,058 | 4.4x |
| 93 | Lake Mohawk | 140 | 9,508 | $149,135 | $553,496 | 3.7x |
| 94 | Tinton Falls | 139 | 19,361 | $117,308 | $624,718 | 5.3x |
| 95 | Point Pleasant | 139 | 19,334 | $115,625 | $733,629 | 6.3x |
| 96 | Red Bank | 139 | 12,862 | $97,477 | $693,364 | 7.1x |
| 97 | Brookdale | 139 | 9,960 | $161,779 | $718,655 | 4.4x |
| 98 | White Meadow Lake | 139 | 8,842 | $149,324 | $589,962 | 4.0x |
| 99 | Elmwood Park | 138 | 21,412 | $101,740 | $616,473 | 6.1x |
| 100 | Asbury Park | 138 | 15,295 | $75,544 | $686,057 | 9.1x |